In Environmental Monitoring and Data Analysis Education, students are trained to treat the environment like a living “instrument panel”—but one where every gauge can drift, every reading has uncertainty, and every conclusion must be earned. Starting from raw observations (sensor streams, field notes, lab results), they learn how rules and standards steer the work: what to measure, how often, how to calibrate, and how to report without bias. Using monitoring hardware, GIS, and analytical methods as their toolkit, learners practice turning noisy measurements into defensible patterns—detecting trends, tracing sources, flagging anomalies, and quantifying risk. The end result is a graduate who can move from data to judgment: producing indicators, reports, and recommendations that decision-makers can actually rely on.
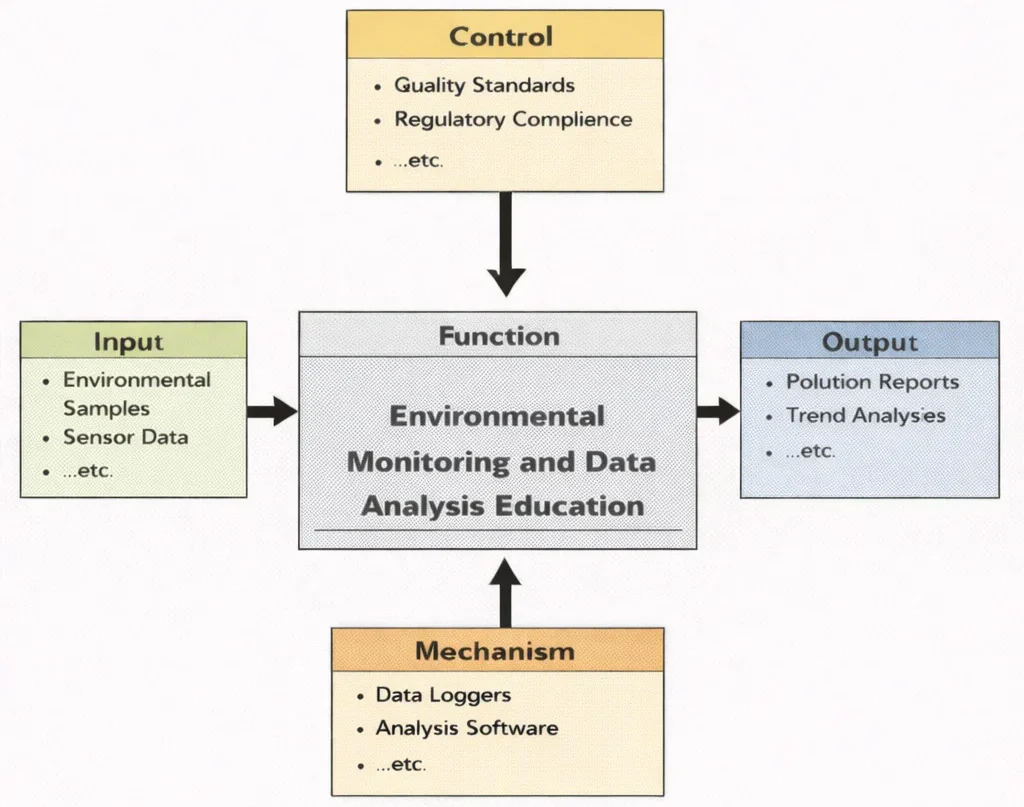
This IDEF0 (Input–Control–Output–Mechanism) diagram summarizes the learning function of Environmental Monitoring and Data Analysis Education. On the left, inputs such as environmental measurements, satellite/remote-sensing signals, and laboratory samples enter the learning process. From above, controls—regulatory standards, sampling protocols, QA/QC requirements, and ethical constraints—shape how data must be collected and interpreted. From below, mechanisms such as sensors and loggers, GIS platforms, statistical and machine-learning tools, and trained personnel enable students to process and validate datasets. The outputs on the right include cleaned datasets, trend and anomaly insights, risk indicators, dashboards and reports, and evidence-based recommendations for policy and engineering decisions.
Environmental Monitoring and Data Analysis plays a foundational role in assessing the health of natural and built environments. This discipline equips students and professionals with the tools to detect, quantify, and interpret changes in air, water, and land systems. It complements broader frameworks in Environmental Engineering by providing the empirical basis for evaluating policy impacts, guiding sustainable development, and ensuring compliance with environmental standards.
Monitoring atmospheric contaminants is essential for addressing concerns in Air Quality Engineering, particularly in urban and industrial zones. Data-driven models support strategies in Climate Change Mitigation and Adaptation, tracking greenhouse gas emissions and forecasting environmental impacts. Furthermore, ecological restoration projects often rely on these methods, as seen in the field of Ecological Engineering.
Decision-making at the policy level is informed by systematic environmental data collection and analysis, aligning with practices in Environmental Policy and Management. Modern building practices, such as Green Building and Sustainable Design, increasingly depend on environmental monitoring to track energy efficiency and indoor air quality. Likewise, the principles of Industrial Ecology and Circular Economy are bolstered by data insights into material flows and lifecycle impacts.
Environmental data is essential for managing energy resources and waste. This is particularly true in sectors like Renewable Energy Systems Engineering and Waste Management Engineering, where performance metrics and environmental outcomes must be continuously evaluated. Hydrological monitoring is a key aspect of Water Resources Engineering, enabling flood risk assessment and water quality control.
Advances in Signal Processing and smart sensor technologies have transformed environmental monitoring, enabling real-time data collection. Robotics applications in Robotics and Automation in E&E are increasingly used in field sampling and hazard detection. Integration with Digital Twin Technology also allows for virtual testing of environmental interventions before physical deployment.
This field intersects with innovations in Industrial and Manufacturing Technologies, especially as industries seek to minimize environmental footprints. Technologies such as Additive Manufacturing (3D Printing) and Advanced Materials and Manufacturing Technologies are now designed with environmental monitoring in mind. Efficiency-focused tools in Energy and Resource Efficiency in Manufacturing depend on environmental data for continuous improvement.
Complementary areas like Computer-Integrated Manufacturing (CIM) and Industrial Automation and Robotics enable seamless integration of environmental monitoring into production systems. Insights from Human Factors and Ergonomics in Manufacturing also ensure that environmental data is effectively interpreted and acted upon. The precision required in Manufacturing Quality Control and Assurance can similarly be applied to environmental performance metrics.
Ultimately, as industries adopt frameworks like Smart Manufacturing and Industry 4.0, the role of environmental data becomes more central. Whether guiding Lean Manufacturing initiatives or supporting digital environmental compliance, this field ensures that sustainability is measurable, accountable, and actionable.

The image shows a researcher working in a high-tech monitoring room filled with large digital screens. A glowing globe and layered interface panels display charts, maps, and symbols for clouds, rainfall, water, and other environmental indicators. In the foreground, a miniature landscape model—trees, fields, and a river—suggests real-world ecosystems being tracked through networks of sensors and satellites. The overall scene communicates how environmental monitoring combines data collection (air and water quality, weather, land use, and emissions) with analysis tools (dashboards, models, and trend graphs) to detect changes, predict risks, and guide policy or operational responses.
- Environmental Engineering topics:
- Environmental Engineering – Overview
- Air Quality Engineering
- Water Resources Engineering
- Waste Management Engineering
- Renewable Energy Systems Engineering
- Industrial Ecology & Circular Economy
- Green Building & Sustainable Design
- Environmental Policy & Management
- Environmental Monitoring & Data Analysis
- Ecological Engineering
- Climate Change Mitigation & Adaptation
Table of Contents
Core Aspects of Environmental Monitoring and Data Analysis
Real-Time Monitoring:
- Real-time monitoring is the backbone of modern environmental management, enabling the continuous and automated collection of data related to air quality, water purity, soil conditions, noise levels, radiation, and more. Using advanced sensor networks, drones, and satellite technologies, data is gathered from remote or difficult-to-access areas with high precision and frequency.
- This immediate stream of information supports rapid responses to emerging threats, such as chemical spills, algal blooms, forest fires, or severe weather events. Early warning systems based on real-time data can activate emergency protocols, initiate evacuations, or prompt adaptive land and water use measures.
- For example, the deployment of wireless sensor networks in industrial zones allows real-time tracking of emissions and particulate matter, helping enforce compliance and protect community health. In marine settings, buoys equipped with telemetry can report on ocean acidification, temperature anomalies, or marine traffic-induced disturbances.
- Importantly, real-time environmental data enhances public engagement by enabling communities and individuals to access pollution indices, weather conditions, or biodiversity alerts via apps and dashboards. This democratization of information fosters accountability and informed decision-making at all levels.
Data Integration and Analysis:
- Data integration involves combining heterogeneous datasets—collected across time, space, and disciplines—into unified platforms that facilitate complex environmental assessments. Sources may include satellite imagery, IoT sensors, citizen science apps, meteorological stations, and historical archives.
- Once consolidated, advanced data analytics tools come into play. Artificial intelligence (AI), machine learning, and geospatial modeling allow for the identification of subtle correlations, prediction of future trends, and generation of actionable insights. These technologies empower stakeholders to simulate scenarios, optimize interventions, and measure the effectiveness of environmental strategies over time.
- For instance, integrating air quality data with health records can reveal exposure-health outcome links, guiding healthcare planning. Similarly, overlaying land-use maps with biodiversity inventories can identify conservation priorities or predict impacts of urban expansion.
- Leading platforms such as the NASA Earthdata Portal exemplify how open-access integration can advance global environmental understanding. By offering vast datasets on climate, land use, oceans, and the atmosphere, such platforms support both scientific discovery and policy formulation.
Sustainability and Conservation:
- Environmental monitoring directly informs sustainability initiatives by tracking the status and trends of natural resources, pollution levels, and ecosystem health. These insights are crucial for balancing economic development with ecological integrity.
- In agriculture, for example, precision farming guided by environmental data can reduce water consumption, minimize chemical use, and increase crop yields without degrading the soil. In forestry, remote sensing helps monitor illegal logging and assess the success of reforestation efforts.
- Conservationists use monitoring to understand species distributions, habitat fragmentation, and migration patterns. This enables the strategic placement of protected areas and wildlife corridors, boosting biodiversity outcomes while involving local communities in stewardship roles.
- Environmental data also plays a pivotal role in helping nations meet global commitments such as the Paris Agreement, the Convention on Biological Diversity, and the Sustainable Development Goals (SDGs). Regular monitoring and transparent reporting ensure accountability and international collaboration on shared environmental objectives.
- Moreover, as climate change accelerates, monitoring informs climate adaptation strategies by identifying vulnerable ecosystems, anticipating stress points, and guiding ecosystem-based responses such as wetland restoration or climate-resilient urban design.
Key Technologies in Environmental Monitoring
Sensors and IoT Devices:
- Air Quality Sensors:
- These sensors continuously measure pollutants such as particulate matter (PM2.5 and PM10), carbon monoxide (CO), nitrogen oxides (NOx), ozone (O₃), volatile organic compounds (VOCs), and other hazardous substances in real time, using laser scattering, electrochemical detection, and optical spectroscopy.
- Applications:
- Urban air quality monitoring networks inform municipal authorities and citizens about smog, pollution spikes, and health advisories.
- Industrial emissions control systems integrate air sensors to detect leaks, regulatory violations, and particulate release from power plants or factories.
- Water Quality Sensors:
- Embed sensors directly into water bodies or treatment systems to detect pH, turbidity, dissolved oxygen (DO), conductivity, temperature, heavy metals, nutrients, pesticides, microbial contaminants, and emerging pollutants like microplastics.
- Applications:
- Ensuring the safety of drinking water supplies through early detection of contamination in municipal distribution networks.
- Assessing riverine, lake, and ocean health by monitoring nutrient pollution, algal blooms, or industrial discharge in real time.
- Soil Sensors:
- Measure soil moisture content, temperature, nutrient levels (nitrogen, phosphorus, potassium), salinity, pH, and trace contaminants using probes and embedded micro-sensors, supporting precision agriculture and land restoration efforts.
- Applications:
- Sustainable farming through data-driven irrigation and fertilization, reducing waste and maximizing crop yields.
- Monitoring land degradation, soil erosion, contamination from spills, or excessive nutrient runoff.
- Wildlife and Biodiversity Sensors:
- Acoustic sensors and microphone arrays capture vocalizations of birds, amphibians, bats, and other wildlife for species identification and population estimation.
- Camera traps and motion-activated optical sensors collect photographic or video evidence, often analyzed with AI to monitor animal presence, behavior, poaching, and migration patterns.
- Applications:
- Tracking endangered species through periodic presence-absence data and habitat use patterns.
- Detecting illegal poaching or habitat encroachment using sensor-triggered alerts and imagery.
- Air Quality Sensors:
Remote Sensing:
- Satellites and Drones:
- Employ advanced imaging—multispectral, hyperspectral, thermal, LiDAR—and radar to capture large-scale environmental data across land, water, and air surfaces.
- Applications:
- Deforestation tracking enables timely detection of illegal logging or habitat loss over thousands of square kilometers.
- Coral reef mapping uses spectral signatures to assess bleaching events and reef health.
- Unmanned Aerial Vehicles (UAVs):
- Provide hyper-local, high-resolution imagery and sensor data—LiDAR, multispectral, thermal—from low altitudes for detailed mapping.
- Applications:
- Precision agriculture via soil and crop health assessments, irrigation needs, and pest infestation detection.
- Rapid response to forest fires, mapping hotspots, spread patterns, and guiding firefighting actions in near real time.
- Satellites and Drones:
AI and Machine Learning:
- Applications:
- Predictive analytics for climate modeling and disaster forecasting help forecast droughts, floods, storm surge events, and wildfire risks based on historical and real-time inputs.
- Pollution hotspot identification utilizes spatial and temporal data from sensors and weather patterns to issue alerts or guide policy measures.
- Species and habitat classification through image and acoustic data processing, automating biodiversity surveys and invasive species detection.
- Examples:
- City-based AI systems predict air quality and adjust urban traffic flows, industrial emissions, or energy usage dynamically.
- Machine learning models forecast water pollution events by analyzing patterns in rainfall, runoff, industrial discharge, and agricultural inputs.
- Applications:
Big Data and Cloud Computing:
- Purpose:
- Provide scalable storage, processing power, and analytics tools to handle massive, continuous streams of environmental data from sensors, satellites, and monitoring networks.
- Applications:
- Real-time environmental dashboards allow governments, industries, and citizens to visualize data—like air and water quality, biodiversity indicators, and weather trends—on interactive maps.
- Collaborative platforms for global environmental data sharing and integration support research, policy-making, and community engagement.
- Examples:
- NASA’s Earth Observing System Data and Information System (EOSDIS) aggregates satellite and ground-station data for climate, land, and ocean applications.
- Global Biodiversity Information Facility (GBIF) catalogs species occurrence data to support conservation science worldwide.
- This centralized approach enables complex queries, predictive modeling, and machine-learning pipelines at scale.
- Purpose:
Blockchain for Environmental Data:
- What It Does:
- Applies decentralized ledgers to ensure transparency, traceability, immutability, and security of environmental records and transactions.
- Applications:
- Carbon credit trading platforms record emissions reductions and transfers transparently.
- Verifying sustainability claims in supply chains—such as deforestation-free certification or water stewardship—via immutable transaction logs.
- What It Does:
By integrating these advanced technologies, environmental monitoring becomes more precise, accessible, and actionable—armoring communities, ecosystems, and decision-makers with the insight needed to protect our planet.
Applications of Environmental Monitoring and Data Analysis
Tracking Pollution Levels:
- Air Quality Monitoring:
- Air quality monitoring enables governments and researchers to identify the sources, intensity, and movement of air pollutants such as PM2.5, NO₂, SO₂, CO, and ozone. These pollutants originate from transport, industry, power plants, and residential heating, posing significant health risks to humans and ecosystems.
- Monitoring stations often use real-time sensors that gather continuous data, which is then used to issue air quality indices (AQI) and health advisories for public awareness. This supports targeted policy actions such as congestion pricing, industrial zoning, and emission caps.
- Beijing’s comprehensive air quality monitoring network, which integrates satellite imagery, ground sensors, and machine learning, serves as a global model for pollution mitigation.
- Water Pollution Monitoring:
- This involves deploying sensors in rivers, lakes, reservoirs, and oceans to detect contaminants including nitrates, phosphates, heavy metals, microplastics, and pathogens. Monitoring water quality supports ecosystem conservation, drinking water safety, and regulatory compliance.
- Early detection helps prevent mass fish kills, algal blooms, and waterborne disease outbreaks. Remote systems like smart buoys can transmit real-time data to centralized dashboards for rapid response.
- One cutting-edge approach includes using IoT-enabled smart buoys to detect oil spills and track their spread using GPS and hydrocarbon sensors.
- These systems have been particularly valuable in shipping lanes and oil extraction zones, where environmental risks are high and swift containment is essential.
- Soil Contamination Monitoring:
- Soil monitoring involves testing for pollutants such as lead, cadmium, arsenic, nitrates, and persistent organic pollutants (POPs) introduced by agriculture, mining, and industrial processes.
- This data guides land remediation projects, such as phytoremediation or soil replacement, and supports policies on pesticide use, land development, and food safety.
- Air Quality Monitoring:
Biodiversity Monitoring:
- Purpose:
- Biodiversity monitoring tracks the status and trends of flora and fauna, identifying population declines, migration shifts, and habitat fragmentation. These insights are essential for evaluating ecosystem health and guiding conservation strategies.
- Applications:
- It helps identify and protect critical habitats, establish conservation corridors, and manage protected areas effectively.
- Data on species distributions enables climate adaptation planning for wildlife, helping conserve genetic diversity under environmental stressors.
- Examples:
- Acoustic monitoring of endangered birds, frogs, and bats in tropical forests captures vocalizations that are analyzed to determine population density and breeding activity.
- Satellite-based mapping of polar bear habitats in the Arctic informs seasonal protections and tourism regulations.
- Purpose:
Resource Usage Monitoring:
- Water Resource Management:
- Water usage monitoring involves placing flow meters, pressure sensors, and leak detectors across supply networks to detect inefficiencies, illegal tapping, or system failures.
- Smart irrigation systems optimize water delivery based on weather forecasts, soil moisture, and crop needs, significantly reducing waste.
- These systems are crucial in arid regions facing water scarcity and agricultural expansion.
- Energy Monitoring:
- Environmental data on energy usage supports demand forecasting, energy efficiency strategies, and renewable energy integration. It includes monitoring carbon intensity and lifecycle emissions.
- Smart meters and home energy dashboards empower consumers to track and reduce their consumption.
- Examples:
- Smart grids use real-time analytics to match energy supply with demand, prevent blackouts, and incorporate solar and wind power seamlessly.
- Land Use Monitoring:
- Satellite imagery and GIS track land use changes including deforestation, urban expansion, mining, and agriculture. This information helps regulate zoning and enforce environmental protection laws.
- Land use datasets support carbon accounting, floodplain management, and biodiversity assessments.
- Water Resource Management:
Disaster Management:
- Purpose:
- Disaster monitoring systems observe atmospheric, hydrological, and geological data to detect early signs of hurricanes, landslides, wildfires, and tsunamis.
- Applications:
- Automated alerts allow preemptive evacuations and targeted deployment of emergency services. Satellite images help assess damages and coordinate recovery logistics.
- Predictive models integrate weather forecasts, terrain data, and infrastructure maps to simulate potential disaster impacts.
- Examples:
- Tsunami detection buoys in the Pacific monitor wave changes and issue alerts via global seismic networks.
- AI-based wildfire detection systems combine thermal imagery and wind models to predict fire spread and issue warnings.
- Purpose:
Climate Change Assessment:
- Applications:
- Data analysis helps track emissions from transportation, industry, agriculture, and power generation through satellite-based spectrometry and emissions inventories.
- Glacier retreat, snowpack melt, ocean acidification, and rising sea levels are monitored with satellite altimetry, ground sensors, and drone photogrammetry.
- Examples:
- NASA’s Climate Change Monitoring Program provides comprehensive datasets and visualizations on Earth’s vital signs, supporting global climate models.
- Global methane tracking satellites detect super emitters and guide mitigation policy in oil, gas, and agriculture sectors.
- Applications:
Urban Environmental Management:
- Applications:
- Environmental monitoring supports live dashboards for heat maps, noise levels, traffic emissions, and green canopy distribution in cities.
- These data feed into policies promoting green infrastructure, pedestrian zones, and public transport expansion.
- Examples:
- Smart city initiatives embed environmental sensors into lamp posts, buildings, and transit systems to create responsive, sustainable urban environments.
- Applications:
Emerging Trends in Environmental Monitoring
Citizen Science and Crowdsourcing:
- Engaging the public in data collection through smartphone apps and low-cost sensors is revolutionizing how environmental data is sourced. These grassroots approaches empower individuals to contribute directly to large-scale scientific efforts, often filling data gaps in regions that lack formal monitoring systems.
- Citizen science projects not only expand geographic coverage but also foster environmental awareness and community engagement. For example, air quality sensors placed in homes or worn on clothing provide hyperlocal pollution data, improving community-level health insights.
- Numerous platforms now offer real-time data visualization and feedback loops, enabling citizens to track the environmental quality of their neighborhoods and advocate for policy changes. Projects like Earthwatch’s FreshWater Watch illustrate how global volunteers can collaboratively monitor freshwater ecosystems.
- Example: Global Forest Watch allows citizens to report deforestation using geotagged photos, satellite imagery comparisons, and alerts based on tree cover loss in specific regions.
Edge Computing:
- Processing data directly at the source, such as within smart sensors or embedded devices, drastically reduces latency and dependency on cloud networks. This is particularly critical for time-sensitive environmental alerts, such as toxic gas leaks or wildfire detection.
- Edge computing enhances the autonomy of monitoring systems, enabling them to take localized actions without needing constant communication with central servers. For example, a water sensor at a remote stream may trigger automatic sampling when turbidity spikes are detected.
- In urban environments, edge-based systems are helping cities optimize traffic flow, manage noise pollution, and respond swiftly to air quality degradation. When integrated with IoT and AI, these systems become adaptive and context-aware.
- Example: Edge-based air quality monitoring is being deployed in smart cities to provide block-level pollution data that feeds directly into transportation and health services.
Digital Twins for Ecosystems:
- Digital twins are advanced, virtual replicas of real-world ecosystems that dynamically mirror their physical counterparts using live data feeds. These tools enable scientists and policymakers to visualize how ecosystems respond to changes in climate, land use, or conservation strategies.
- By simulating scenarios such as pollution dispersion, species migration, or flood mitigation, digital twins reduce the need for trial-and-error experimentation in the real environment, saving time and minimizing ecological disruption.
- These virtual models are enhanced with machine learning algorithms to refine predictions over time. Data from satellites, drones, and ground sensors feed into the twin, updating its parameters continuously for precision analysis.
- Applications:
- Managing forests and coral reefs through predictive modeling of growth patterns, bleaching risks, and human disturbances.
- Testing interventions for urban planning, including green infrastructure placement, stormwater management, and thermal comfort enhancements.
AI-Powered Autonomous Monitoring Systems:
- Drones and autonomous underwater vehicles (AUVs) equipped with AI are increasingly being used for environmental monitoring in hard-to-reach or dangerous environments. These systems reduce human risk while improving data resolution and frequency.
- For instance, AI-enhanced image recognition helps identify illegal logging, monitor glacier retreat, and track wildlife populations with minimal manual input. These intelligent systems can learn patterns of normalcy and detect anomalies over time.
- Such autonomy is especially valuable in remote ecosystems, where logistical constraints hinder regular human surveillance. Automated data collection ensures continuity and objectivity, particularly in time-series studies.
- Example: AI-enabled drones are currently monitoring Arctic ice loss, capturing high-resolution imagery and transmitting it for further analysis and climate modeling.
Integrated Environmental Monitoring Networks:
- Combining terrestrial, aquatic, and atmospheric data creates a comprehensive picture of environmental health across ecosystems. These integrated networks unify data from satellites, meteorological stations, biosensors, and more into cohesive platforms.
- Such holistic monitoring frameworks help detect cross-domain interactions—such as how forest fires impact air quality, water acidity, and animal migration. The synthesis of multi-domain data facilitates ecosystem-wide decision-making.
- These networks are crucial for tracking progress toward international climate and biodiversity targets. Governments, researchers, and NGOs increasingly rely on them to design interventions and assess impacts across borders.
- Example: The European Space Agency’s Copernicus program offers open-access, high-frequency environmental monitoring across land, water, and atmosphere, supporting disaster response, climate modeling, and sustainable development.
Challenges in Environmental Monitoring and Data Analysis
Data Overload:
- The exponential growth of environmental data—generated through satellites, IoT sensors, citizen science, and research initiatives—has led to an overwhelming influx of information. This vast quantity of data, while valuable, presents significant challenges in terms of organization, storage, and interpretation.
- Many environmental monitoring systems lack the interoperability to harmonize datasets from different platforms or institutions, leading to redundancy and inefficiencies in data usage. Moreover, inconsistencies in data formats, quality, and resolution hinder comprehensive analysis and comparative assessments across regions or timeframes.
- Without effective data governance strategies, the risk of underutilizing valuable information or making misinformed decisions increases. Environmental professionals often struggle to filter relevant data quickly enough to inform emergency responses, such as during wildfire outbreaks or toxic spills.
- Solution: Advanced AI algorithms and cloud computing platforms offer transformative potential by automating the classification, visualization, and interpretation of vast datasets. These technologies enable the creation of real-time dashboards, predictive models, and early warning systems that can aid in both policy and practice. A practical example is the use of platforms like [Google Earth Engine](https://earthengine.google.com/) for processing petabytes of satellite data to monitor environmental trends globally.
Accessibility and Equity:
- Although technological advancements have enhanced data collection and analysis capabilities, access to high-quality environmental data remains uneven across the globe. Developing countries, indigenous communities, and marginalized populations often lack the infrastructure, training, or funding to participate meaningfully in environmental monitoring initiatives.
- Language barriers, digital divides, and licensing restrictions on proprietary datasets further exacerbate disparities in data access. As a result, environmental degradation in underserved areas may go unreported or under-addressed, perpetuating cycles of ecological and social vulnerability.
- It is critical that inclusive strategies are implemented to ensure that data-driven insights benefit all populations, particularly those most affected by climate change, pollution, and resource scarcity.
- Solution: Open-access platforms, such as the Global Earth Observation System of Systems (GEOSS), are expanding the availability of environmental data worldwide. Furthermore, international collaborations are increasingly funding capacity-building programs that equip local scientists and communities with tools and skills to collect, interpret, and act on environmental data effectively.
Technological Limitations:
- Despite impressive advancements, environmental monitoring technologies still face gaps in coverage, especially in remote, rugged, or politically unstable regions. Harsh weather conditions, dense vegetation, or lack of infrastructure can impair sensor deployment and limit data accuracy.
- Moreover, many sensors degrade over time, require regular calibration, or are not designed to detect emerging pollutants or novel ecosystem stressors. This limits the scope of monitoring programs, especially when governments or organizations rely heavily on legacy technologies.
- Miniaturized sensors, though increasingly available, often trade off accuracy or durability in exchange for portability and affordability. Ensuring consistency and reliability across diverse monitoring platforms remains a key technical challenge.
- Solution: Investment in robust, low-cost, and scalable technologies—including solar-powered devices, wireless sensor networks, and biodegradable sensors—is essential. Emerging innovations, such as biosensors that detect contaminants in real-time, are also showing promise in expanding monitoring coverage with minimal environmental impact.
Policy and Implementation Gaps:
- Even when accurate and timely environmental data is available, translating it into meaningful policy remains an enduring challenge. The disconnect between data producers (scientists, technologists) and data users (policymakers, resource managers) can result in missed opportunities for informed decision-making.
- In many regions, legal frameworks are outdated or lack specific provisions for incorporating scientific data into regulatory mechanisms. This is further compounded by bureaucratic inertia, political interests, or limited institutional capacity to interpret complex environmental datasets.
- Data often fails to drive urgent interventions due to a lack of actionable thresholds, conflicting stakeholder interests, or delays in reporting. Furthermore, there is frequently insufficient communication between national and local governments, hampering coordinated responses.
- Solution: Strengthening collaboration between scientists, policymakers, and stakeholders is vital. Multi-stakeholder forums, co-production of knowledge, and participatory modeling are increasingly recognized as effective ways to bridge the gap between evidence and action. Integrating environmental data into budgeting, urban planning, and disaster preparedness frameworks ensures that insights lead to tangible outcomes.
Future Directions in Environmental Monitoring and Data Analysis
Global Data Sharing Initiatives:
- The future of environmental monitoring is deeply rooted in global collaboration and transparent data exchange. As environmental issues transcend political boundaries, access to shared, reliable, and standardized data becomes indispensable for coordinated responses to climate change, biodiversity loss, and pollution events. Global data sharing initiatives are emerging as vital mechanisms to facilitate such collaboration, enabling governments, researchers, NGOs, and private entities to act on a unified evidence base.
- Collaborative platforms allow for the aggregation of real-time data from satellites, ground sensors, citizen scientists, and institutional repositories. These platforms often employ standardized metadata protocols and open-source architectures to ensure accessibility and interoperability. Projects such as the United Nations Environment Programme’s (UNEP) World Environment Situation Room exemplify how digital infrastructure can provide open-access, multilingual interfaces for environmental data across themes such as land use, water, air quality, and ecosystem health. Such platforms support rapid assessments, comparative analyses, and knowledge dissemination among stakeholders.
- By fostering transparency and reducing duplication of efforts, global data sharing initiatives empower under-resourced regions to benefit from advanced analytics and monitoring infrastructure they might not otherwise afford. Moreover, these collaborations help standardize environmental indicators globally, ensuring that nations can track progress toward international targets such as the SDGs or the Paris Agreement.
- Example: United Nations Environment Programme’s (UNEP) global databases provide not only historical and real-time data but also tools for visualization, forecasting, and risk assessment. These databases play a crucial role in shaping national environmental strategies, disaster preparedness plans, and research priorities.
Predictive Environmental Management:
- Environmental monitoring is evolving beyond reactive assessments into proactive management through predictive technologies. With the integration of artificial intelligence (AI), machine learning, and big data analytics, institutions can now anticipate ecological changes and respond before adverse outcomes escalate. Predictive environmental management shifts the focus from damage control to risk prevention, allowing more efficient allocation of resources and policy interventions.
- AI models trained on historical and real-time data can recognize patterns associated with specific environmental events such as algal blooms, droughts, pest outbreaks, or wildfire risks. These models can generate forecasts ranging from hours to seasons, offering critical lead time to mitigate impacts on ecosystems, economies, and public health. The precision and adaptability of AI systems improve continuously as they ingest larger and more diverse datasets from sensors, drones, and remote sensing platforms.
- In addition to forecasting, AI tools can also recommend context-specific actions, such as deploying aerators in nutrient-rich lakes to prevent oxygen depletion or modifying crop planting schedules to reduce agricultural losses during dry spells. This transforms environmental management into a dynamic, real-time process integrated with decision support systems.
- Example: Predicting algal blooms in freshwater lakes to prevent fish kills. These early warnings allow for water treatment adjustments, community advisories, and ecological remediation before irreversible damage occurs.
Integration with Climate Finance:
- Environmental monitoring is increasingly intersecting with climate finance, a growing field that mobilizes capital for projects aimed at reducing greenhouse gas emissions and enhancing climate resilience. Accurate and verifiable environmental data is essential for measuring the impact of these investments, assuring transparency, and validating the outcomes of climate-related initiatives.
- Data-driven mechanisms are now being used to underpin carbon markets, where entities trade emissions allowances or carbon credits. By linking emissions reductions to tangible, monitored outcomes—such as forest conservation or renewable energy projects—environmental monitoring ensures the credibility and accountability of market-based climate actions. This enhances investor confidence and helps channel funds into impactful environmental initiatives.
- Moreover, the integration of blockchain technology is enhancing traceability in climate finance. Blockchain provides immutable ledgers for recording data related to carbon offsets, resource use, and ecosystem services. This ensures that credits are not double-counted and that project developers, funders, and regulators can independently verify environmental claims in real time.
- Example: Blockchain-enabled platforms for tracking carbon credits have emerged to improve transparency, reduce transaction costs, and democratize access to carbon finance markets, particularly for small-scale forest owners and conservation projects.
Space-Based Monitoring Expansion:
- Satellite technologies have long played a foundational role in environmental monitoring, but the future envisions a dramatic expansion in capabilities, resolution, and application. Space agencies and private companies alike are developing new generations of satellites equipped with hyperspectral sensors, radar imaging, and machine learning capabilities to offer continuous and precise monitoring of the Earth’s surface, atmosphere, and oceans.
- These satellites are capable of detecting subtle shifts in vegetation health, water turbidity, land subsidence, or ice sheet dynamics that would be difficult to measure from the ground. Space-based monitoring is particularly critical for covering vast, remote, or politically inaccessible areas where ground-based data collection is limited or impossible. It is also indispensable during disasters such as floods or wildfires, where fast and large-scale data collection is essential for response and recovery.
- The miniaturization of satellite technology—such as CubeSats—has made space-based monitoring more affordable and scalable. With constellations of small satellites working in unison, data can be updated multiple times per day, enhancing the temporal resolution and improving the responsiveness of monitoring networks.
- Example: Advanced hyperspectral imaging satellites are now being deployed to monitor agricultural productivity, detect crop stress, and assess soil moisture. Similarly, these satellites help identify water quality changes in lakes and coastal zones, detect harmful algal blooms, and measure nutrient runoff into aquatic systems.
Why Study Environmental Monitoring and Data Analysis
Collecting Reliable Environmental Data
Environmental monitoring involves measuring air, water, and soil quality using scientific instruments. Students learn how to design monitoring programs and operate sensors. Accurate data collection is critical for detecting trends and managing resources.
Instrument Calibration and Field Methods
Students gain hands-on experience with instruments such as spectrometers, data loggers, and samplers. They learn how to ensure data accuracy through calibration and quality assurance. These skills are essential for field-based environmental research.
Data Management and Statistical Analysis
Collected data must be organized, cleaned, and analyzed to reveal meaningful patterns. Students learn how to use software tools like R, Excel, or Python to interpret environmental datasets. This supports decision-making and reporting.
Applications in Policy and Regulation
Monitoring data informs regulations, permits, and enforcement actions. Students study how governments use data to guide environmental planning and compliance. Their work directly contributes to public and environmental health.
Real-Time Monitoring and Remote Sensing
Students explore emerging technologies such as satellite imagery and sensor networks. These tools enable real-time observation of environmental changes. This supports early warning systems and rapid response.
Environmental Monitoring and Data Analysis: Conclusion
Environmental monitoring and data analysis play a crucial role in addressing pressing global challenges such as climate change, biodiversity loss, and pollution. These disciplines form the foundation of evidence-based environmental decision-making, enabling scientists, policymakers, and communities to detect changes, assess risks, and design effective interventions. By collecting and analyzing data from air, water, soil, and ecosystems, we gain a clearer understanding of both natural dynamics and human impacts on the environment. Real-time monitoring systems, satellite observations, and ground-based sensors offer unparalleled insights into ecological conditions and allow for timely responses to environmental threats.
The growing accessibility of data science tools and the proliferation of open-source platforms have expanded the reach and capability of environmental monitoring systems. Big data analytics and machine learning algorithms can process vast datasets to uncover hidden patterns and predict environmental trends, such as forecasting air pollution hotspots, tracking deforestation in remote regions, or identifying marine biodiversity shifts caused by rising sea temperatures. Such analytical power supports proactive policymaking and enhances public awareness, equipping stakeholders with the knowledge needed to promote sustainability and resilience at all scales.
Collaboration remains a key pillar in the future of environmental data analysis. Multi-sectoral partnerships involving government agencies, academic researchers, non-profit organizations, and the private sector foster innovation and data sharing across boundaries. Initiatives such as citizen science programs and community-based monitoring increase public engagement and data inclusivity. Furthermore, global networks like the Global Earth Observation System of Systems (GEOSS) integrate data from various nations and sensors to build a comprehensive picture of the Earth’s environment, facilitating cross-border responses to climate crises and ecological degradation.
As environmental challenges grow in scale and complexity, the demand for integrated, real-time data will continue to rise. To meet this need, future developments will likely focus on enhancing data interoperability, developing predictive environmental intelligence, and promoting transparency through open-access data portals. These advancements will empower societies to identify emerging risks early, track progress toward environmental goals, and implement adaptive management strategies with greater precision and agility.
Ultimately, environmental monitoring and data analysis are not just technical tools—they are vital enablers of a just and sustainable future. Their contributions extend beyond environmental protection to encompass human health, economic development, disaster preparedness, and global equity. As we refine our technologies and cultivate global cooperation, the insights derived from environmental data will help chart a more informed, resilient, and ecologically harmonious path forward.
Environmental Monitoring and Data Analysis: Review Questions with Detailed Answers:
1. What is environmental monitoring, and why is it crucial in environmental engineering?
Answer:
Environmental monitoring is the systematic process of collecting, analyzing, and interpreting data to track the quality and health of the environment. It involves observing various environmental parameters such as air and water quality, soil conditions, and biodiversity to detect changes, identify trends, and assess the impact of human activities.
Importance in Environmental Engineering:
- Assessment and Compliance: Ensures that environmental standards and regulations are met, preventing pollution and degradation.
- Impact Evaluation: Helps in evaluating the effectiveness of environmental management strategies and engineering projects.
- Early Warning: Detects potential environmental issues early, allowing for timely interventions to mitigate adverse effects.
- Resource Management: Aids in the sustainable management of natural resources by providing accurate data on their status and trends.
- Decision Making: Informs policymakers, engineers, and stakeholders with reliable data to make informed decisions regarding environmental protection and restoration.
Example:
Monitoring air quality in an urban area helps identify pollution sources and evaluate the effectiveness of traffic regulations in reducing emissions.
2. Describe the key components of an environmental monitoring system in environmental engineering projects.
Answer:
An environmental monitoring system typically comprises several key components that work together to ensure accurate and reliable data collection and analysis:
Sensors and Instruments:
- Function: Detect and measure specific environmental parameters such as temperature, pH, dissolved oxygen, particulate matter, and pollutant concentrations.
- Types: Stationary monitors, portable devices, and remote sensing equipment.
Data Collection:
- Function: Gather data from various sensors and instruments, often in real-time.
- Methods: Automated data loggers, manual sampling, and remote data transmission.
Data Transmission and Storage:
- Function: Transfer collected data to centralized databases for storage and access.
- Technologies: Wireless networks, cloud storage, and secure servers.
Data Processing and Analysis:
- Function: Convert raw data into meaningful information through processing, statistical analysis, and interpretation.
- Tools: Software applications, statistical packages, and geographic information systems (GIS).
Reporting and Visualization:
- Function: Present data in accessible formats such as reports, graphs, maps, and dashboards.
- Purpose: Facilitate understanding and communication of environmental conditions to stakeholders and decision-makers.
Maintenance and Calibration:
- Function: Ensure that all components of the monitoring system are functioning correctly and providing accurate measurements.
- Activities: Regular calibration of sensors, maintenance of equipment, and troubleshooting issues.
Example:
A water quality monitoring system in a river may include sensors for pH and turbidity, data loggers to collect measurements every hour, wireless transmission to a central database, and GIS software to visualize pollutant distribution.
3. What are the primary methods used for data analysis in environmental monitoring, and how do they contribute to understanding environmental trends?
Answer:
Data analysis in environmental monitoring involves various methods to interpret collected data, identify patterns, and understand environmental trends. The primary methods include:
Descriptive Statistics:
- Function: Summarize and describe the main features of the data.
- Tools: Mean, median, mode, standard deviation, and range.
- Contribution: Provides a clear overview of environmental parameters, highlighting central tendencies and variability.
Time Series Analysis:
- Function: Analyze data points collected or recorded at specific time intervals.
- Tools: Moving averages, trend analysis, seasonal decomposition.
- Contribution: Identifies long-term trends, seasonal patterns, and cyclical behaviors in environmental data.
Geospatial Analysis:
- Function: Examine spatial patterns and relationships within the data.
- Tools: Geographic Information Systems (GIS), spatial interpolation, hotspot analysis.
- Contribution: Maps the distribution of environmental variables, revealing spatial trends and identifying areas of concern.
Multivariate Analysis:
- Function: Analyze data involving multiple variables simultaneously.
- Tools: Principal Component Analysis (PCA), Cluster Analysis, Multiple Regression.
- Contribution: Understands the relationships between different environmental factors, identifying key drivers and interactions.
Predictive Modeling:
- Function: Forecast future environmental conditions based on historical data.
- Tools: Regression models, machine learning algorithms, simulation models.
- Contribution: Anticipates future trends, supports proactive environmental management, and aids in decision-making.
Comparative Analysis:
- Function: Compare current data with historical benchmarks or regulatory standards.
- Tools: Control charts, compliance assessments.
- Contribution: Evaluates changes over time and determines whether environmental conditions meet desired standards.
Example:
Time series analysis of temperature data can reveal warming trends over decades, while geospatial analysis can identify regions experiencing the most significant temperature increases.
4. Explain the role of Geographic Information Systems (GIS) in environmental monitoring and data analysis.
Answer:
Geographic Information Systems (GIS) play a pivotal role in environmental monitoring and data analysis by providing powerful tools for spatial data management, visualization, and analysis. GIS integrates various types of data with geographic locations, enabling comprehensive examination of environmental phenomena.
Key Roles of GIS:
Data Integration and Management:
- Function: Combines spatial data (e.g., maps, satellite imagery) with attribute data (e.g., pollutant concentrations, species distributions).
- Benefit: Facilitates the storage, organization, and retrieval of large datasets, enhancing data accessibility and usability.
Spatial Visualization:
- Function: Creates maps and spatial representations of environmental data.
- Benefit: Helps visualize complex data patterns, making it easier to identify spatial trends, hotspots, and relationships.
Spatial Analysis:
- Function: Analyzes spatial relationships and interactions between different environmental variables.
- Tools: Buffering, overlay analysis, spatial interpolation, and network analysis.
- Benefit: Enables the identification of correlations, causations, and spatial dependencies within the data.
Trend Mapping and Monitoring:
- Function: Tracks changes in environmental parameters over time and space.
- Benefit: Assists in monitoring environmental degradation, land use changes, and the effectiveness of conservation efforts.
Decision Support:
- Function: Provides insights and visual tools to support environmental decision-making and policy development.
- Benefit: Enhances the ability of policymakers and stakeholders to make informed decisions based on spatial data and analysis.
Resource Management:
- Function: Optimizes the allocation and management of natural resources by analyzing spatial distribution and usage patterns.
- Benefit: Promotes sustainable resource management and minimizes environmental impacts.
Example:
GIS can be used to map the distribution of water quality parameters across a watershed, identifying areas with high pollutant levels and informing targeted remediation efforts.
5. What are the common challenges faced in environmental data collection, and how can they be addressed to ensure data accuracy and reliability?
Answer:
Environmental data collection is essential for monitoring and managing ecosystems, but it often faces several challenges that can affect data accuracy and reliability. Addressing these challenges requires strategic planning, technological solutions, and rigorous quality control measures.
Common Challenges:
Spatial and Temporal Variability:
- Challenge: Environmental parameters can vary significantly across different locations and times, making it difficult to capture comprehensive data.
- Solutions:
- Strategic Sampling: Design sampling plans that cover diverse areas and time periods to capture variability.
- Automated Monitoring Systems: Use continuous monitoring devices to collect data consistently over time.
Instrumentation and Calibration Issues:
- Challenge: Instruments may drift, malfunction, or provide inaccurate readings if not properly calibrated and maintained.
- Solutions:
- Regular Calibration: Schedule routine calibration of instruments to ensure accuracy.
- Maintenance Protocols: Implement maintenance schedules and protocols to keep equipment in optimal condition.
Data Gaps and Inconsistencies:
- Challenge: Missing data points and inconsistencies can arise from equipment failures, human error, or environmental disruptions.
- Solutions:
- Redundant Systems: Use backup sensors and data collection methods to minimize data loss.
- Data Validation: Employ data quality checks and validation techniques to identify and address inconsistencies.
Access and Logistical Constraints:
- Challenge: Collecting data from remote or hazardous locations can be difficult and resource-intensive.
- Solutions:
- Remote Sensing: Utilize satellite imagery and drones to gather data from inaccessible areas.
- Mobile Monitoring Units: Deploy portable monitoring stations that can be easily transported to various sites.
Human Error:
- Challenge: Mistakes in data recording, handling, or entry can compromise data integrity.
- Solutions:
- Training and Protocols: Provide comprehensive training for personnel and establish standardized data collection protocols.
- Automation: Implement automated data collection and entry systems to reduce reliance on manual processes.
Environmental Interference:
- Challenge: Harsh environmental conditions can damage equipment or interfere with data collection processes.
- Solutions:
- Robust Equipment: Use weather-resistant and durable instruments designed for specific environmental conditions.
- Protective Measures: Implement protective housings and shelters to safeguard equipment from extreme weather and other environmental factors.
Ensuring Data Accuracy and Reliability:
- Quality Assurance and Quality Control (QA/QC): Establish QA/QC protocols to systematically verify data quality at every stage of collection and processing.
- Standardized Procedures: Adopt standardized data collection and processing methods to ensure consistency across different projects and locations.
- Peer Review and Auditing: Conduct peer reviews and independent audits of data collection processes to identify and rectify potential issues.
Conclusion: Addressing the challenges in environmental data collection is crucial for obtaining accurate and reliable data, which is essential for effective environmental monitoring and management. By implementing strategic sampling, regular calibration, redundancy, remote sensing, automation, and robust QA/QC protocols, environmental engineers can overcome common obstacles and ensure the integrity of their data.
6. Discuss the importance of data visualization in environmental monitoring and how it aids in decision-making processes.
Answer:
Data visualization is a critical component of environmental monitoring as it transforms complex datasets into understandable and actionable visual formats. Effective visualization aids in interpreting data, identifying patterns, and communicating findings to stakeholders, thereby enhancing decision-making processes.
Importance of Data Visualization:
Simplifies Complex Data:
- Function: Converts large and intricate datasets into graphical representations such as charts, maps, and graphs.
- Benefit: Makes complex information more accessible and easier to comprehend for diverse audiences, including non-experts.
Identifies Patterns and Trends:
- Function: Highlights spatial and temporal trends, correlations, and anomalies within the data.
- Benefit: Facilitates the detection of environmental changes, emerging issues, and the effectiveness of interventions.
Enhances Communication:
- Function: Provides clear and compelling visuals that convey key insights and findings.
- Benefit: Improves communication between environmental engineers, policymakers, stakeholders, and the public, fostering informed discussions and collaborative decision-making.
Supports Decision-Making:
- Function: Presents data-driven evidence in a format that aids in evaluating options and outcomes.
- Benefit: Enables decision-makers to assess the implications of different strategies, prioritize actions, and allocate resources effectively.
Facilitates Monitoring and Reporting:
- Function: Tracks progress over time and visualizes changes in environmental parameters.
- Benefit: Assists in monitoring the success of environmental management initiatives and fulfilling regulatory reporting requirements.
Tools and Techniques for Data Visualization:
- Geographic Information Systems (GIS): Creates spatial maps that display the distribution of environmental variables.
- Dashboards: Interactive platforms that consolidate multiple data visualizations, providing real-time insights.
- Infographics: Combines data with visual elements to tell a cohesive story or highlight key points.
- 3D Models and Simulations: Offers immersive representations of environmental scenarios and potential impacts.
Example:
A dashboard displaying real-time air quality data with color-coded maps, trend lines showing pollutant levels over time, and alerts for exceedances can help city officials quickly identify pollution hotspots and implement targeted mitigation measures.
Conclusion: Data visualization is indispensable in environmental monitoring as it enhances the understanding, communication, and application of environmental data. By effectively visualizing data, environmental engineers can support evidence-based decision-making, promote transparency, and engage stakeholders in meaningful ways to address environmental challenges.
7. What are the ethical considerations in environmental monitoring and data analysis, and how can engineers ensure responsible handling of environmental data?
Answer:
Ethical considerations in environmental monitoring and data analysis are paramount to ensure the integrity, accuracy, and responsible use of environmental data. Environmental engineers must navigate issues related to data privacy, accuracy, transparency, and the potential impacts of their work on communities and ecosystems.
Key Ethical Considerations:
Data Accuracy and Integrity:
- Importance: Ensuring that data is accurate, reliable, and free from manipulation is fundamental to maintaining trust and credibility.
- Responsibilities: Engineers must adhere to strict quality control measures, verify data sources, and avoid biases in data collection and analysis.
Transparency and Honesty:
- Importance: Openly sharing methodologies, data sources, and potential limitations fosters trust and enables others to validate findings.
- Responsibilities: Engineers should provide clear documentation of their processes, openly communicate uncertainties, and disclose any conflicts of interest.
Privacy and Confidentiality:
- Importance: Protecting sensitive information, especially when monitoring human-related environmental impacts, is crucial to respecting individuals’ privacy.
- Responsibilities: Implement data anonymization techniques, secure data storage, and limit access to confidential information to authorized personnel only.
Informed Consent and Community Engagement:
- Importance: Engaging with communities affected by environmental monitoring projects ensures that their rights and interests are respected.
- Responsibilities: Obtain informed consent when collecting data from or about individuals, involve communities in project planning, and consider their feedback and concerns.
Responsible Data Use:
- Importance: Utilizing data ethically to avoid misuse, such as manipulating findings for personal or organizational gain, is essential for maintaining ethical standards.
- Responsibilities: Use data solely for its intended purposes, avoid misrepresentation of results, and ensure that data-driven decisions benefit the environment and society.
Environmental Justice:
- Importance: Ensuring that environmental monitoring does not disproportionately burden marginalized or vulnerable communities.
- Responsibilities: Conduct equitable data collection, address disparities in environmental quality, and involve affected communities in decision-making processes.
Ensuring Responsible Handling of Environmental Data:
Adhering to Ethical Guidelines:
- Approach: Follow established ethical standards and guidelines set by professional organizations and regulatory bodies.
- Benefit: Provides a framework for ethical conduct and decision-making in data handling.
Implementing Robust Quality Control:
- Approach: Establish and enforce stringent quality assurance and quality control (QA/QC) protocols throughout the data lifecycle.
- Benefit: Ensures the reliability and validity of data, preventing errors and inaccuracies.
Promoting Transparency:
- Approach: Share methodologies, data sources, and analytical processes openly with stakeholders and the public.
- Benefit: Enhances accountability and allows for independent verification and replication of results.
Securing Data Privacy:
- Approach: Utilize encryption, access controls, and anonymization techniques to protect sensitive data.
- Benefit: Safeguards individuals’ privacy and maintains the confidentiality of sensitive information.
Engaging with Stakeholders:
- Approach: Involve communities, policymakers, and other stakeholders in the planning and implementation of monitoring projects.
- Benefit: Ensures that projects are aligned with community needs and ethical considerations, fostering trust and collaboration.
Continuous Ethical Training:
- Approach: Provide ongoing training and education on ethical standards and best practices for environmental engineers and data analysts.
- Benefit: Keeps professionals informed about ethical responsibilities and equips them to handle complex ethical dilemmas.
Conclusion: Ethical considerations are integral to environmental monitoring and data analysis, guiding engineers to handle data responsibly and maintain public trust. By prioritizing accuracy, transparency, privacy, community engagement, and environmental justice, environmental engineers can ensure that their work contributes positively to environmental sustainability and societal well-being.
8. How do remote sensing technologies enhance environmental monitoring, and what are some common applications of these technologies in environmental engineering?
Answer:
Remote sensing technologies significantly enhance environmental monitoring by providing comprehensive, real-time, and large-scale data collection capabilities. These technologies utilize sensors mounted on satellites, aircraft, drones, or ground-based platforms to capture information about the Earth’s surface and atmosphere without direct contact.
Enhancements Provided by Remote Sensing:
Large-Scale Coverage:
- Function: Enables the observation of vast and inaccessible areas that would be challenging or impossible to monitor using ground-based methods.
- Benefit: Facilitates regional and global assessments of environmental conditions and changes.
Real-Time Data Acquisition:
- Function: Provides timely data that can be used for immediate analysis and decision-making.
- Benefit: Supports rapid response to environmental emergencies such as floods, wildfires, and oil spills.
High-Resolution Imaging:
- Function: Offers detailed images and measurements of environmental features with high spatial, temporal, and spectral resolution.
- Benefit: Enhances the ability to detect subtle changes and monitor specific environmental parameters accurately.
Multi-Spectral and Hyper-Spectral Data:
- Function: Captures data across multiple wavelengths, including visible, infrared, and ultraviolet spectra.
- Benefit: Enables the identification and analysis of various environmental phenomena, such as vegetation health, water quality, and soil moisture.
Cost-Effectiveness:
- Function: Reduces the need for extensive field surveys, lowering the costs associated with data collection.
- Benefit: Makes large-scale and frequent monitoring more economically feasible.
Common Applications in Environmental Engineering:
Land Use and Land Cover Mapping:
- Application: Identifying and classifying different land use types (e.g., urban, agricultural, forested) and land cover features.
- Benefit: Supports urban planning, habitat conservation, and land management decisions.
Water Resource Management:
- Application: Monitoring surface water bodies, assessing water quality, tracking water levels, and detecting algal blooms.
- Benefit: Aids in the sustainable management of water resources and the prevention of water pollution.
Vegetation Health and Forestry:
- Application: Assessing vegetation cover, biomass estimation, detecting stress or disease in plants, and monitoring deforestation.
- Benefit: Enhances forest management, biodiversity conservation, and carbon sequestration efforts.
Climate Change Studies:
- Application: Tracking changes in ice cover, sea level rise, temperature variations, and vegetation shifts over time.
- Benefit: Provides critical data for understanding and mitigating the impacts of climate change.
Disaster Management and Mitigation:
- Application: Detecting and monitoring natural disasters such as floods, hurricanes, wildfires, and earthquakes.
- Benefit: Facilitates early warning systems, emergency response planning, and post-disaster assessment.
Pollution Monitoring:
- Application: Identifying and tracking sources of pollution, such as oil spills, industrial emissions, and agricultural runoff.
- Benefit: Supports environmental remediation efforts and enforcement of pollution control regulations.
Soil and Agricultural Monitoring:
- Application: Assessing soil moisture, nutrient levels, crop health, and agricultural productivity.
- Benefit: Promotes sustainable agricultural practices and soil conservation.
Example:
Using satellite imagery to monitor deforestation in the Amazon rainforest allows environmental engineers to quantify forest loss, identify illegal logging activities, and implement conservation strategies effectively.
Conclusion: Remote sensing technologies are indispensable tools in environmental monitoring, offering extensive coverage, real-time data, and detailed insights into various environmental parameters. Their applications in land use mapping, water resource management, vegetation monitoring, climate studies, disaster management, pollution tracking, and agricultural monitoring significantly enhance the capabilities of environmental engineers to assess, manage, and protect ecosystems sustainably.
9. What are the key differences between qualitative and quantitative data in environmental monitoring, and how are each utilized in data analysis?
Answer:
Qualitative and quantitative data are two fundamental types of information collected during environmental monitoring, each serving distinct purposes in data analysis and decision-making processes.
Key Differences:
Nature of Data:
- Qualitative Data:
- Description: Non-numerical information that describes qualities, attributes, or characteristics.
- Examples: Observations of species behavior, descriptions of habitat conditions, visual assessments of water clarity.
- Quantitative Data:
- Description: Numerical information that can be measured and quantified.
- Examples: Concentrations of pollutants, temperature readings, population counts of species.
- Qualitative Data:
Data Collection Methods:
- Qualitative Data:
- Methods: Interviews, focus groups, field observations, descriptive notes.
- Quantitative Data:
- Methods: Sampling and measurement using instruments, sensors, surveys with numerical responses.
- Qualitative Data:
Data Analysis Techniques:
- Qualitative Data:
- Techniques: Thematic analysis, content analysis, narrative analysis.
- Purpose: Identifying patterns, themes, and insights from descriptive information.
- Quantitative Data:
- Techniques: Statistical analysis, mathematical modeling, data visualization.
- Purpose: Measuring variables, testing hypotheses, and identifying correlations or trends.
- Qualitative Data:
Outcome and Application:
- Qualitative Data:
- Outcome: Provides depth and context, understanding the “why” and “how” behind environmental phenomena.
- Application: Informing policy development, enhancing interpretation of quantitative results, capturing stakeholder perspectives.
- Quantitative Data:
- Outcome: Provides precision and objectivity, enabling measurement and comparison of environmental parameters.
- Application: Monitoring compliance with regulations, assessing environmental changes, supporting predictive modeling.
- Qualitative Data:
Utilization in Data Analysis:
Qualitative Data:
- Contextual Understanding: Enhances the understanding of environmental issues by providing context and insights that numbers alone cannot capture.
- Hypothesis Generation: Helps in formulating hypotheses for further quantitative research.
- Stakeholder Engagement: Captures the perceptions and experiences of stakeholders, ensuring that projects address their concerns and needs.
Quantitative Data:
- Objective Measurement: Provides objective measurements of environmental parameters, essential for monitoring and assessment.
- Trend Analysis: Enables the identification of trends and patterns over time and space, supporting evidence-based decision-making.
- Comparative Studies: Facilitates comparisons between different sites, time periods, or treatment methods to evaluate effectiveness and impact.
Example:
In a study on river health, quantitative data might include measurements of dissolved oxygen levels and pollutant concentrations, while qualitative data could involve observations of fish behavior and community interviews about perceived water quality changes. Together, these data types provide a comprehensive understanding of the river’s condition.
Conclusion: Both qualitative and quantitative data are essential in environmental monitoring, each offering unique strengths. Qualitative data provides depth and context, while quantitative data offers precision and measurable insights. Utilizing both types of data in tandem enhances the robustness of environmental assessments, enabling more informed and effective decision-making in environmental engineering projects.
10. How can machine learning and artificial intelligence be applied in environmental monitoring and data analysis, and what are the potential benefits and limitations of these technologies?
Answer:
Machine learning (ML) and artificial intelligence (AI) are increasingly being integrated into environmental monitoring and data analysis, offering advanced capabilities for processing large datasets, identifying patterns, and making predictions. These technologies enhance the efficiency and accuracy of environmental assessments and management strategies.
Applications in Environmental Monitoring and Data Analysis:
Predictive Modeling:
- Function: Use historical data to forecast future environmental conditions such as pollutant levels, climate trends, and species populations.
- Example: Predicting the spread of invasive species based on environmental variables and past distribution patterns.
Anomaly Detection:
- Function: Identify unusual patterns or outliers in environmental data that may indicate pollution events, equipment malfunctions, or ecological disturbances.
- Example: Detecting sudden spikes in air pollution levels that could signify industrial emissions violations.
Image and Signal Processing:
- Function: Analyze satellite imagery, aerial photos, and sensor data to monitor land use changes, vegetation health, and water quality.
- Example: Using computer vision algorithms to assess deforestation rates from satellite images.
Data Integration and Management:
- Function: Combine data from various sources and formats to create comprehensive environmental datasets.
- Example: Integrating weather data, water quality measurements, and biodiversity records to assess ecosystem health.
Optimization of Monitoring Networks:
- Function: Optimize the placement and operation of sensors and monitoring stations to maximize data quality and coverage.
- Example: Using ML algorithms to determine the most effective locations for air quality sensors in a city.
Automated Reporting and Visualization:
- Function: Generate automated reports and dynamic visualizations that summarize and present environmental data insights.
- Example: Creating real-time dashboards that display current pollution levels and trends using AI-driven data aggregation.
Potential Benefits:
Enhanced Efficiency:
- Benefit: Automates data processing and analysis, reducing the time and labor required for manual tasks.
- Impact: Enables faster decision-making and more timely responses to environmental issues.
Improved Accuracy and Precision:
- Benefit: Reduces human error and enhances the accuracy of data analysis through advanced algorithms.
- Impact: Provides more reliable insights for environmental management and policy development.
Scalability:
- Benefit: Capable of handling and analyzing vast amounts of data from multiple sources simultaneously.
- Impact: Facilitates large-scale environmental monitoring and the ability to track complex ecological processes.
Advanced Pattern Recognition:
- Benefit: Identifies subtle and complex patterns in data that may be difficult to detect using traditional methods.
- Impact: Enhances the understanding of environmental dynamics and the ability to predict future changes.
Adaptive Learning:
- Benefit: Continuously improves its performance and accuracy as more data becomes available.
- Impact: Enhances the reliability of predictions and the effectiveness of monitoring systems over time.
Potential Limitations:
Data Quality and Availability:
- Limitation: ML and AI models require large, high-quality datasets to function effectively.
- Challenge: Incomplete, biased, or inaccurate data can lead to unreliable outcomes and incorrect predictions.
Complexity and Expertise:
- Limitation: Developing and implementing ML and AI models require specialized knowledge and expertise.
- Challenge: A shortage of skilled professionals can hinder the adoption and effective use of these technologies in environmental engineering.
Interpretability and Transparency:
- Limitation: Some ML and AI models operate as “black boxes,” making it difficult to understand how decisions are made.
- Challenge: Lack of transparency can reduce trust in the results and complicate the validation of model outputs.
Cost and Resource Requirements:
- Limitation: Developing, training, and maintaining ML and AI systems can be resource-intensive and costly.
- Challenge: High costs may limit access and implementation, especially in resource-constrained settings.
Ethical and Privacy Concerns:
- Limitation: The use of AI and ML in environmental monitoring may raise ethical issues related to data privacy, surveillance, and the potential misuse of data.
- Challenge: Ensuring responsible and ethical use of these technologies is essential to avoid negative societal impacts.
Conclusion: Machine learning and artificial intelligence hold significant promise for enhancing environmental monitoring and data analysis in environmental engineering. By enabling predictive modeling, anomaly detection, and advanced data processing, these technologies can improve the efficiency, accuracy, and scalability of environmental assessments. However, challenges related to data quality, expertise, interpretability, cost, and ethics must be carefully managed to fully realize their potential and ensure responsible application. Balancing the benefits with these limitations will be crucial for the successful integration of ML and AI in environmental engineering practices.
Environmental Monitoring and Data Analysis: Thought-Provoking Questions with Detailed Answers:
1. How can real-time data acquisition systems transform the effectiveness of environmental monitoring, and what engineering challenges must be addressed to implement these systems?
Answer:
Real-time data acquisition systems revolutionize environmental monitoring by providing immediate access to current environmental conditions, enabling prompt responses to emerging issues. These systems collect data continuously or at frequent intervals, offering up-to-date information that enhances the ability to monitor, analyze, and manage environmental parameters effectively.
Transformation of Effectiveness:
Immediate Response to Environmental Changes:
- Impact: Allows for rapid detection and mitigation of pollution events, natural disasters, and other environmental disturbances.
- Example: Real-time air quality monitoring can trigger alerts and interventions during sudden spikes in pollutant levels.
Enhanced Data Accuracy and Precision:
- Impact: Reduces the likelihood of data loss and inaccuracies associated with manual sampling and reporting.
- Example: Automated sensors provide consistent and precise measurements of water quality parameters, eliminating human error.
Improved Trend Analysis and Predictive Capabilities:
- Impact: Facilitates the identification of short-term and long-term trends, aiding in predictive modeling and proactive environmental management.
- Example: Continuous temperature and humidity data can be used to predict heatwaves and implement cooling measures in vulnerable areas.
Increased Efficiency and Cost-Effectiveness:
- Impact: Minimizes the need for extensive fieldwork and reduces labor costs associated with manual data collection.
- Example: Remote sensing and automated monitoring systems cover large areas with minimal human intervention.
Engineering Challenges:
Data Transmission and Connectivity:
- Challenge: Ensuring reliable and continuous data transmission, especially in remote or harsh environments.
- Solutions: Utilize robust wireless communication technologies, satellite links, and redundant transmission pathways to maintain connectivity.
Power Supply and Energy Management:
- Challenge: Providing a consistent power source for sensors and data acquisition equipment, particularly in off-grid locations.
- Solutions: Implement renewable energy sources like solar or wind power, and use energy-efficient hardware to extend battery life.
Data Storage and Management:
- Challenge: Handling the vast amounts of data generated by real-time systems and ensuring secure, organized storage.
- Solutions: Employ cloud-based storage solutions, implement data compression techniques, and use scalable databases to manage growing datasets.
Sensor Calibration and Maintenance:
- Challenge: Maintaining the accuracy and reliability of sensors over time, requiring regular calibration and maintenance.
- Solutions: Design systems with easy access for maintenance, use self-calibrating sensors, and implement predictive maintenance strategies using data analytics.
Data Security and Privacy:
- Challenge: Protecting sensitive environmental data from unauthorized access and ensuring data integrity.
- Solutions: Implement strong encryption protocols, secure authentication methods, and regular security audits to safeguard data.
Integration with Existing Systems:
- Challenge: Ensuring compatibility and seamless integration with legacy systems and other data sources.
- Solutions: Develop standardized data interfaces, use modular system designs, and adopt interoperable technologies to facilitate integration.
Conclusion: Real-time data acquisition systems significantly enhance the effectiveness of environmental monitoring by providing timely, accurate, and comprehensive data. However, engineering challenges related to connectivity, power supply, data management, sensor maintenance, data security, and system integration must be addressed to fully realize the potential of these systems. Overcoming these challenges will lead to more responsive and efficient environmental management practices, ultimately contributing to better environmental protection and sustainability.
2. In what ways can citizen science initiatives contribute to environmental monitoring, and what engineering solutions can support the integration of citizen-collected data with professional monitoring systems?
Answer:
Citizen science initiatives involve the participation of non-professional volunteers in data collection and environmental monitoring. These initiatives can significantly expand the scope and scale of environmental monitoring efforts, providing diverse data sources and fostering community engagement in environmental stewardship.
Contributions of Citizen Science:
Expanded Data Coverage:
- Impact: Increases the geographic and temporal coverage of environmental monitoring, capturing data from areas that professional monitoring systems may not reach.
- Example: Volunteers can collect water quality samples from multiple locations along a river, providing a comprehensive view of its health.
Increased Data Frequency:
- Impact: Enhances the temporal resolution of data collection, allowing for more detailed trend analysis and timely detection of environmental changes.
- Example: Daily air quality measurements taken by volunteers complement automated sensors, providing granular insights into pollution patterns.
Cost-Effectiveness:
- Impact: Reduces the financial burden on professional monitoring programs by leveraging volunteer labor and resources.
- Example: Community-led bird counts help monitor biodiversity without the need for extensive funding from governmental agencies.
Community Engagement and Awareness:
- Impact: Fosters a sense of ownership and responsibility among community members, promoting environmental education and advocacy.
- Example: Participating in local clean-up events and monitoring projects increases public awareness of pollution issues and encourages sustainable practices.
Diverse Perspectives and Innovation:
- Impact: Brings diverse skills and innovative ideas to environmental monitoring, enhancing the quality and creativity of data collection methods.
- Example:
Volunteer developers create mobile apps that facilitate real-time data entry and geotagging of environmental observations.
Engineering Solutions to Support Integration:
Standardized Data Collection Protocols:
- Solution: Develop and disseminate standardized guidelines and protocols for data collection to ensure consistency and reliability of citizen-collected data.
- Benefit: Ensures that data from various sources are comparable and can be seamlessly integrated with professional datasets.
Mobile and Web-Based Platforms:
- Solution: Create user-friendly mobile apps and web platforms that enable volunteers to easily input, upload, and share data.
- Benefit: Simplifies data submission, reduces entry errors, and enhances participation by making the process accessible and intuitive.
Data Validation and Quality Control:
- Solution: Implement automated data validation algorithms and manual review processes to verify the accuracy and integrity of citizen-collected data.
- Benefit: Maintains high data quality standards, ensuring that integrated datasets are reliable and actionable.
Geospatial Integration:
- Solution: Use Geographic Information Systems (GIS) to spatially integrate citizen-collected data with professional monitoring systems.
- Benefit: Enhances the spatial analysis capabilities, allowing for comprehensive mapping and trend identification across larger areas.
Interoperability Standards:
- Solution: Adopt interoperability standards and open data formats to facilitate seamless data exchange between citizen science platforms and professional monitoring systems.
- Benefit: Enables efficient data integration, sharing, and analysis across different platforms and organizations.
Training and Support:
- Solution: Provide training resources, tutorials, and technical support to volunteers to improve data collection skills and ensure proper use of monitoring tools.
- Benefit: Enhances data quality by equipping volunteers with the necessary knowledge and skills to collect accurate and meaningful data.
Data Security and Privacy Measures:
- Solution: Implement robust security protocols to protect the integrity and confidentiality of the data collected by volunteers.
- Benefit: Safeguards sensitive information and builds trust among participants, encouraging ongoing engagement and data sharing.
Integration with Professional Systems:
- Solution: Develop APIs and data connectors that allow seamless data flow between citizen science platforms and professional environmental monitoring systems.
- Benefit: Facilitates real-time data integration, enabling comprehensive analysis and timely decision-making based on combined datasets.
Example:
A city implements a citizen science program where residents use a mobile app to report sightings of invasive plant species. The app automatically geotags each observation and validates data through image recognition algorithms. The data is then integrated into the city’s GIS system, allowing environmental engineers to map the spread of invasive species and plan targeted removal efforts.
Conclusion: Citizen science initiatives greatly enhance environmental monitoring by expanding data coverage, increasing data frequency, and fostering community engagement. Engineering solutions such as standardized protocols, user-friendly platforms, data validation systems, geospatial integration, interoperability standards, training, data security measures, and seamless integration with professional systems are essential for effectively incorporating citizen-collected data. These solutions ensure that citizen science data complement and enhance professional monitoring efforts, leading to more comprehensive and informed environmental management.
3. How can sensor technology advancements improve the precision and scope of environmental monitoring, and what are the potential applications of these advanced sensors in environmental engineering?
Answer:
Advancements in sensor technology have significantly improved the precision, reliability, and scope of environmental monitoring, enabling more detailed and accurate data collection. These advanced sensors enhance the capability to monitor a wide range of environmental parameters in various settings, supporting more effective environmental engineering solutions.
Improvements in Precision and Scope:
Increased Sensitivity and Accuracy:
- Advancement: Modern sensors can detect minute changes in environmental parameters with high precision.
- Impact: Enables the detection of subtle environmental changes, improving the ability to monitor and respond to environmental issues promptly.
Miniaturization and Portability:
- Advancement: Sensors have become smaller and more portable, allowing for deployment in diverse and hard-to-reach locations.
- Impact: Expands the areas and environments that can be monitored, including remote and hazardous sites.
Wireless and IoT Integration:
- Advancement: Integration with wireless networks and the Internet of Things (IoT) facilitates real-time data transmission and remote monitoring.
- Impact: Enhances the efficiency and scalability of environmental monitoring systems, enabling continuous and widespread data collection.
Multi-Parameter Sensing:
- Advancement: Advanced sensors can measure multiple parameters simultaneously, such as temperature, humidity, pH, and pollutant levels.
- Impact: Provides comprehensive datasets that offer a more holistic view of environmental conditions.
Energy Efficiency and Longevity:
- Advancement: Improved energy-efficient designs and renewable energy integration extend the operational life of sensors.
- Impact: Reduces maintenance needs and increases the reliability of long-term monitoring projects.
Potential Applications in Environmental Engineering:
Air Quality Monitoring:
- Application: Deploying advanced gas sensors to measure concentrations of pollutants like CO₂, NOx, SO₂, and particulate matter.
- Benefit: Enables detailed assessment of air quality, identification of pollution sources, and evaluation of the effectiveness of air quality regulations.
Water Quality Monitoring:
- Application: Using multi-parameter water sensors to continuously monitor parameters such as pH, dissolved oxygen, turbidity, and contaminant levels.
- Benefit: Facilitates real-time detection of water pollution, supports the management of water treatment processes, and ensures compliance with water quality standards.
Soil Health Assessment:
- Application: Implementing soil sensors to monitor moisture levels, nutrient content, and soil temperature.
- Benefit: Enhances soil management practices, supports sustainable agriculture, and prevents soil degradation.
Climate Monitoring:
- Application: Utilizing weather stations equipped with advanced sensors to track temperature, humidity, wind speed, and precipitation.
- Benefit: Provides accurate climate data for modeling, forecasting, and assessing the impacts of climate change.
Biodiversity and Habitat Monitoring:
- Application: Deploying acoustic sensors and motion-activated cameras to monitor wildlife presence and behavior.
- Benefit: Supports biodiversity conservation efforts by providing insights into species distribution, population dynamics, and habitat utilization.
Flood and Disaster Monitoring:
- Application: Installing flood sensors and early warning systems to detect rising water levels and predict flood events.
- Benefit: Enhances disaster preparedness, reduces damage to infrastructure, and protects lives by enabling timely evacuation and response measures.
Energy Management:
- Application: Using sensors in green buildings to monitor energy consumption, indoor environmental quality, and system performance.
- Benefit: Optimizes energy use, improves building efficiency, and supports sustainable urban development.
Industrial Emission Monitoring:
- Application: Implementing continuous emission monitoring systems (CEMS) with advanced sensors to track industrial pollutant releases.
- Benefit: Ensures compliance with environmental regulations, reduces pollution, and minimizes the environmental impact of industrial activities.
Example:
Advanced water quality sensors deployed in a river can continuously monitor pH, dissolved oxygen, and heavy metal concentrations. The real-time data is transmitted wirelessly to a central database, where environmental engineers analyze trends and identify pollution sources promptly, enabling swift remediation actions.
Conclusion: Advancements in sensor technology have greatly enhanced the precision and scope of environmental monitoring, enabling more comprehensive and accurate data collection. These advanced sensors have diverse applications in environmental engineering, from air and water quality monitoring to climate assessment and biodiversity conservation. By leveraging these technologies, environmental engineers can develop more effective strategies for environmental protection, sustainable resource management, and proactive response to environmental challenges.
4. How can data interoperability standards facilitate the integration of diverse environmental datasets, and what are the benefits of achieving seamless data interoperability in environmental engineering projects?
Answer:
Data interoperability standards are frameworks and protocols that enable different data systems and formats to communicate, share, and utilize data seamlessly. In environmental engineering projects, achieving data interoperability is essential for integrating diverse datasets from various sources, enhancing the efficiency and effectiveness of data analysis and decision-making.
Facilitation of Integration:
Standardized Data Formats:
- Function: Establish common data structures and formats (e.g., JSON, XML, CSV) that allow different systems to interpret and use data consistently.
- Benefit: Ensures compatibility between datasets from different sensors, platforms, and organizations, enabling smooth data exchange and aggregation.
Common Metadata Standards:
- Function: Define standardized metadata schemas that describe the context, quality, and structure of datasets.
- Benefit: Enhances data discoverability, usability, and comparability by providing consistent descriptions of data sources and attributes.
APIs and Data Sharing Protocols:
- Function: Develop application programming interfaces (APIs) and protocols (e.g., OGC standards) that facilitate automated data sharing and integration.
- Benefit: Enables real-time data exchange and interoperability between disparate systems, supporting dynamic and collaborative data usage.
Semantic Standards and Ontologies:
- Function: Utilize standardized vocabularies and ontologies to ensure that data meanings are consistently understood across different systems.
- Benefit: Prevents misinterpretation of data by aligning terminologies and concepts, enabling accurate data integration and analysis.
Data Governance Frameworks:
- Function: Implement policies and practices that ensure data quality, security, and compliance with interoperability standards.
- Benefit: Promotes trust and reliability in integrated datasets, ensuring that data can be effectively used for decision-making.
Benefits of Seamless Data Interoperability:
Enhanced Data Accessibility and Sharing:
- Benefit: Facilitates easy access to a wide range of datasets, promoting collaboration among environmental engineers, researchers, and stakeholders.
- Impact: Accelerates the development of comprehensive environmental assessments and solutions by leveraging diverse data sources.
Improved Data Quality and Consistency:
- Benefit: Ensures that integrated datasets are consistent, accurate, and reliable, reducing errors and enhancing the validity of analyses.
- Impact: Leads to more robust and credible environmental engineering outcomes, supporting effective decision-making and policy development.
Increased Efficiency and Reduced Redundancy:
- Benefit: Eliminates the need for manual data conversion and duplication, saving time and resources.
- Impact: Streamlines data workflows, allowing engineers to focus on analysis and application rather than data management.
Facilitated Comprehensive Analysis:
- Benefit: Enables the combination of diverse datasets (e.g., air quality, water quality, land use) for holistic environmental analysis.
- Impact: Provides a more complete understanding of environmental systems, supporting integrated and multifaceted engineering solutions.
Support for Advanced Technologies:
- Benefit: Enhances the effectiveness of machine learning, artificial intelligence, and big data analytics by providing well-integrated and standardized datasets.
- Impact: Unlocks new possibilities for predictive modeling, trend analysis, and innovative environmental engineering applications.
Scalability and Adaptability:
- Benefit: Allows environmental monitoring systems to scale and adapt by easily incorporating new data sources and technologies.
- Impact: Ensures that environmental engineering projects remain flexible and can evolve with emerging data needs and technological advancements.
Example:
An environmental engineering project aiming to assess urban air quality can integrate data from satellite remote sensing, ground-based sensor networks, and traffic monitoring systems using standardized data formats and metadata. This seamless integration allows for comprehensive analysis of pollution sources, dispersion patterns, and the effectiveness of mitigation measures.
Conclusion: Data interoperability standards are crucial for integrating diverse environmental datasets, enabling seamless data sharing, enhancing data quality, and supporting comprehensive analysis in environmental engineering projects. Achieving data interoperability fosters collaboration, increases efficiency, and facilitates the use of advanced technologies, ultimately leading to more effective and informed environmental management and engineering solutions.
5. How can engineers ensure the ethical use of big data in environmental monitoring, particularly concerning data privacy and security?
Answer:
The ethical use of big data in environmental monitoring is essential to protect individual privacy, ensure data security, and maintain public trust. Engineers must implement robust strategies and adhere to ethical principles to manage and utilize big data responsibly.
Ensuring Ethical Use:
Data Anonymization and Aggregation:
- Strategy: Remove personally identifiable information (PII) and aggregate data to prevent the identification of individuals or sensitive locations.
- Implementation: Use techniques such as data masking, pseudonymization, and aggregation to protect privacy while retaining the usefulness of the data.
- Benefit: Balances the need for detailed environmental data with the protection of individual privacy rights.
Access Control and Data Security:
- Strategy: Implement stringent access controls to ensure that only authorized personnel can access sensitive data.
- Implementation: Use authentication mechanisms, role-based access controls, and encryption to safeguard data.
- Benefit: Prevents unauthorized access, data breaches, and misuse of environmental data.
Transparency and Consent:
- Strategy: Clearly communicate the purpose, methods, and uses of data collection to stakeholders and obtain informed consent where necessary.
- Implementation: Provide detailed privacy policies, consent forms, and transparent reporting on data usage practices.
- Benefit: Builds trust with data contributors and stakeholders by ensuring that they are aware of and agree to how their data is used.
Ethical Data Governance:
- Strategy: Establish data governance frameworks that outline ethical guidelines, responsibilities, and procedures for data handling.
- Implementation: Create policies that define data ownership, usage rights, and ethical standards, and ensure compliance through regular audits and reviews.
- Benefit: Provides a structured approach to managing data ethically, ensuring consistency and accountability in data practices.
Minimization of Data Collection:
- Strategy: Collect only the data that is necessary for the intended environmental monitoring objectives.
- Implementation: Define clear data collection goals and avoid gathering extraneous information that could pose privacy risks.
- Benefit: Reduces the potential for privacy infringements and simplifies data management processes.
Secure Data Storage and Transmission:
- Strategy: Use secure methods for storing and transmitting data to protect it from unauthorized access and cyber threats.
- Implementation: Employ encryption, secure servers, and secure communication protocols to safeguard data at rest and in transit.
- Benefit: Ensures the confidentiality and integrity of environmental data, preventing unauthorized alterations and access.
Regular Ethical Training and Awareness:
- Strategy: Provide ongoing training for engineers and data handlers on ethical standards and best practices in data management.
- Implementation: Conduct workshops, seminars, and training sessions focused on data ethics, privacy laws, and security measures.
- Benefit: Ensures that all team members are aware of their ethical responsibilities and are equipped to handle data appropriately.
Impact Assessments:
- Strategy: Conduct ethical impact assessments to evaluate the potential privacy and security implications of big data initiatives.
- Implementation: Assess the risks associated with data collection, storage, and analysis, and develop mitigation strategies accordingly.
- Benefit: Identifies and addresses ethical concerns before they arise, ensuring that data practices are responsible and compliant with ethical standards.
Benefits of Ethical Big Data Use:
Trust and Credibility:
- Benefit: Ethical data practices build trust with the public, stakeholders, and data contributors, enhancing the credibility of environmental monitoring efforts.
- Impact: Encourages greater participation and cooperation in data collection initiatives.
Legal Compliance:
- Benefit: Adhering to data privacy laws and regulations (e.g., GDPR, CCPA) ensures legal compliance and avoids potential legal repercussions.
- Impact: Protects organizations from fines, sanctions, and reputational damage associated with data breaches and privacy violations.
Enhanced Data Quality:
- Benefit: Ethical data practices often result in higher quality data as contributors feel secure and are more likely to provide accurate and comprehensive information.
- Impact: Improves the reliability and validity of environmental analyses and decision-making processes.
Sustainable Data Management:
- Benefit: Establishing ethical data practices ensures the long-term sustainability of data collection and monitoring initiatives by maintaining public support and minimizing risks.
- Impact: Supports ongoing environmental monitoring and management efforts without compromising ethical standards.
Conclusion: Ensuring the ethical use of big data in environmental monitoring is crucial for protecting privacy, maintaining data security, and fostering public trust. By implementing strategies such as data anonymization, access control, transparency, ethical governance, data minimization, secure storage, ethical training, and impact assessments, engineers can responsibly manage and utilize big data. These practices not only uphold ethical standards but also enhance the effectiveness and credibility of environmental monitoring and data analysis efforts.
6. What are the best practices for maintaining data quality and integrity in large-scale environmental monitoring projects?
Answer:
Maintaining data quality and integrity in large-scale environmental monitoring projects is essential for ensuring the reliability and accuracy of the data, which in turn supports effective environmental management and decision-making. Best practices for achieving high data quality and integrity include meticulous planning, robust protocols, and continuous quality assurance measures.
Best Practices:
Comprehensive Planning and Design:
- Approach: Develop a detailed monitoring plan that outlines objectives, methodologies, sampling strategies, and data management protocols.
- Benefit: Ensures that data collection is systematic, consistent, and aligned with project goals, reducing the likelihood of errors and inconsistencies.
Standardized Protocols and Procedures:
- Approach: Implement standardized data collection, processing, and analysis protocols across all monitoring sites and teams.
- Benefit: Promotes consistency and comparability of data, minimizing variability due to differing methodologies.
Rigorous Calibration and Maintenance of Instruments:
- Approach: Regularly calibrate sensors and instruments to ensure accurate measurements and conduct routine maintenance to prevent malfunctions.
- Benefit: Enhances the accuracy and reliability of data by ensuring that instruments function correctly.
Quality Assurance and Quality Control (QA/QC) Programs:
- Approach: Establish QA/QC protocols that include procedures for data verification, validation, and error detection.
- Benefit: Identifies and corrects data errors and anomalies, ensuring high data quality and integrity.
Training and Competency of Personnel:
- Approach: Provide comprehensive training for all personnel involved in data collection and handling to ensure they understand and adhere to protocols.
- Benefit: Reduces the risk of human error and enhances the consistency and accuracy of data collection.
Data Documentation and Metadata Management:
- Approach: Maintain detailed documentation of data collection methods, instrument settings, calibration records, and any deviations from protocols.
- Benefit: Facilitates data traceability, reproducibility, and interpretation by providing context and background information.
Automated Data Collection and Processing:
- Approach: Utilize automated systems and software for data collection, transmission, and processing to reduce manual handling and errors.
- Benefit: Increases efficiency, reduces the likelihood of human error, and ensures timely data availability.
Regular Data Audits and Reviews:
- Approach: Conduct periodic audits and reviews of collected data to assess quality and identify potential issues.
- Benefit: Ensures ongoing data integrity and allows for the timely implementation of corrective actions.
Redundancy and Backup Systems:
- Approach: Implement redundant data storage solutions and backup systems to protect against data loss due to technical failures or disasters.
- Benefit: Ensures the availability and preservation of data, safeguarding against accidental loss or corruption.
Robust Data Security Measures:
- Approach: Protect data from unauthorized access and breaches through encryption, access controls, and secure storage solutions.
- Benefit: Maintains data integrity by preventing tampering, unauthorized alterations, and loss.
Stakeholder Engagement and Communication:
- Approach: Engage with stakeholders to communicate data quality standards, methodologies, and findings transparently.
- Benefit: Builds trust and ensures that data users understand the quality and limitations of the data, promoting informed decision-making.
Adaptive Management and Continuous Improvement:
- Approach: Continuously evaluate and improve data collection and management processes based on feedback and new technologies.
- Benefit: Enhances data quality over time by incorporating lessons learned and adapting to evolving project needs.
Example:
In a large-scale air quality monitoring project, standardized protocols ensure that all sensors are calibrated using the same reference standards. Automated data loggers transmit data in real-time to a centralized database, where QA/QC software flags any anomalies for review. Regular training sessions keep personnel updated on best practices, and data audits are conducted quarterly to maintain integrity.
Conclusion: Maintaining data quality and integrity in large-scale environmental monitoring projects requires a combination of meticulous planning, standardized protocols, rigorous QA/QC measures, and ongoing training and audits. By implementing these best practices, environmental engineers can ensure that the data collected is accurate, reliable, and suitable for informed environmental management and decision-making.
7. How can interdisciplinary collaboration enhance environmental data analysis, and what strategies can engineers use to foster effective collaboration among different scientific disciplines?
Answer:
Interdisciplinary collaboration enhances environmental data analysis by integrating diverse perspectives, expertise, and methodologies from various scientific disciplines. This holistic approach leads to more comprehensive and accurate interpretations of environmental data, fostering innovative solutions to complex environmental challenges.
Enhancements Through Interdisciplinary Collaboration:
Comprehensive Understanding:
- Benefit: Combines knowledge from ecology, chemistry, physics, statistics, computer science, and social sciences to provide a well-rounded understanding of environmental issues.
- Impact: Enables the identification of multifaceted relationships and interactions within environmental systems.
Innovative Solutions:
- Benefit: Encourages the development of creative and effective solutions by leveraging different expertise and methodologies.
- Impact: Facilitates the design of advanced monitoring systems, predictive models, and sustainable management practices.
Improved Data Interpretation:
- Benefit: Diverse analytical approaches enhance the interpretation and validation of data.
- Impact: Increases the accuracy and reliability of conclusions drawn from environmental data.
Enhanced Problem-Solving:
- Benefit: Facilitates the identification of root causes and systemic issues by considering multiple factors and viewpoints.
- Impact: Promotes effective and sustainable problem-solving strategies in environmental engineering projects.
Strategies to Foster Effective Collaboration:
Establish Clear Communication Channels:
- Strategy: Develop structured communication platforms (e.g., regular meetings, collaborative software) to facilitate information exchange.
- Benefit: Ensures that all team members are informed and can contribute effectively to discussions and decision-making processes.
Define Common Goals and Objectives:
- Strategy: Align team members around shared goals and clearly define project objectives.
- Benefit: Promotes unity and focuses collaborative efforts on achieving specific outcomes.
Create Interdisciplinary Teams:
- Strategy: Form teams that include members from different scientific and engineering disciplines.
- Benefit: Encourages the sharing of diverse expertise and fosters mutual learning among team members.
Encourage Mutual Respect and Understanding:
- Strategy: Promote an inclusive and respectful team culture where each discipline’s contributions are valued.
- Benefit: Enhances collaboration by building trust and appreciation for diverse perspectives.
Implement Integrated Project Management:
- Strategy: Use project management tools and frameworks that support interdisciplinary workflows and integrated task coordination.
- Benefit: Streamlines collaboration and ensures that all aspects of the project are cohesively managed.
Provide Cross-Training Opportunities:
- Strategy: Offer training sessions and workshops that educate team members about other disciplines’ methodologies and terminologies.
- Benefit: Facilitates better understanding and communication across disciplines, reducing potential misunderstandings.
Utilize Collaborative Technologies:
- Strategy: Employ technologies such as shared databases, collaborative software, and cloud platforms that enable real-time data sharing and joint analysis.
- Benefit: Enhances accessibility and integration of data, supporting seamless collaboration among team members.
Encourage Joint Problem-Solving Sessions:
- Strategy: Conduct brainstorming and problem-solving sessions that involve members from all disciplines.
- Benefit: Promotes innovative thinking and the generation of comprehensive solutions that consider multiple perspectives.
Define Roles and Responsibilities Clearly:
- Strategy: Assign specific roles and responsibilities to team members based on their expertise and disciplinary strengths.
- Benefit: Ensures accountability and efficient utilization of each member’s skills, preventing overlap and confusion.
Foster a Collaborative Culture:
- Strategy: Encourage teamwork, open-mindedness, and the sharing of ideas and knowledge.
- Benefit: Creates an environment where collaboration thrives, leading to more effective and innovative outcomes.
Example:
In a project assessing the impact of urbanization on river ecosystems, an interdisciplinary team might include ecologists, hydrologists, chemists, data scientists, and urban planners. By collaborating, the team can comprehensively analyze water quality data, model hydrological changes, assess biodiversity impacts, and develop sustainable urban planning strategies to mitigate negative effects.
Conclusion: Interdisciplinary collaboration significantly enhances environmental data analysis by integrating diverse expertise and methodologies, leading to more comprehensive and innovative solutions. Engineers can foster effective collaboration by establishing clear communication, defining common goals, creating interdisciplinary teams, promoting mutual respect, implementing integrated project management, providing cross-training, utilizing collaborative technologies, encouraging joint problem-solving, clearly defining roles, and fostering a collaborative culture. These strategies ensure that interdisciplinary teams work synergistically, maximizing the potential for successful environmental engineering projects.
8. How can cloud computing and big data technologies be leveraged to manage and analyze large volumes of environmental data, and what are the advantages of using these technologies in environmental monitoring?
Answer:
Cloud computing and big data technologies are transformative tools in environmental monitoring, enabling the efficient management, storage, and analysis of vast amounts of environmental data. These technologies enhance the capacity to process complex datasets, derive actionable insights, and support informed decision-making in environmental engineering.
Leveraging Cloud Computing and Big Data:
Scalable Storage Solutions:
- Function: Provide virtually unlimited storage capacity to handle large volumes of environmental data generated from sensors, remote sensing, and other monitoring sources.
- Application: Storing continuous data streams from air quality sensors across a city, satellite imagery, and historical environmental records.
High-Performance Computing (HPC):
- Function: Offer powerful computational resources to process and analyze large and complex datasets efficiently.
- Application: Running complex climate models, simulating pollutant dispersion, and performing high-resolution spatial analyses.
Data Integration and Management:
- Function: Facilitate the integration of diverse datasets from multiple sources, ensuring seamless data accessibility and interoperability.
- Application: Combining data from ground-based sensors, satellite observations, and social media feeds for comprehensive environmental assessments.
Advanced Data Analytics:
- Function: Utilize big data analytics tools and machine learning algorithms to extract meaningful patterns, trends, and insights from large datasets.
- Application: Predicting future pollution levels based on historical data, identifying hotspots of environmental degradation, and optimizing resource allocation for conservation efforts.
Real-Time Data Processing:
- Function: Enable the processing and analysis of data in real time, supporting timely decision-making and immediate responses to environmental changes.
- Application: Real-time monitoring of river levels to trigger flood warnings, or air quality indices to alert residents about unhealthy pollution levels.
Collaborative Platforms:
- Function: Support collaboration among researchers, engineers, policymakers, and stakeholders by providing shared access to data and analytical tools.
- Application: Collaborative projects where multiple institutions contribute and access data through a centralized cloud platform, facilitating joint research and coordinated responses to environmental issues.
Advantages of Using Cloud Computing and Big Data:
Cost-Effectiveness:
- Advantage: Reduces the need for substantial investments in physical infrastructure, as cloud services operate on a pay-as-you-go model.
- Benefit: Makes advanced data management and analysis capabilities accessible to organizations with limited budgets.
Flexibility and Scalability:
- Advantage: Easily scales storage and computational resources up or down based on project needs without the constraints of physical hardware limitations.
- Benefit: Supports dynamic project requirements, such as increased data volume during environmental events or expanded monitoring efforts over time.
Enhanced Data Accessibility:
- Advantage: Provides global access to data and analytical tools from any location with internet connectivity.
- Benefit: Facilitates remote collaboration, data sharing, and accessibility for stakeholders and decision-makers.
Improved Data Security and Backup:
- Advantage: Cloud providers implement robust security measures, including encryption, access controls, and regular backups to protect data.
- Benefit: Ensures the safety and integrity of environmental data, reducing the risk of data loss and unauthorized access.
Advanced Analytical Capabilities:
- Advantage: Offers a wide range of big data analytics tools, machine learning frameworks, and visualization platforms that can handle complex environmental data.
- Benefit: Enhances the ability to derive actionable insights, predict environmental trends, and develop informed management strategies.
Rapid Deployment and Updates:
- Advantage: Facilitates the quick deployment of new applications, tools, and updates without the need for extensive IT resources.
- Benefit: Allows environmental engineers to stay current with technological advancements and implement improvements swiftly.
Interoperability and Integration:
- Advantage: Supports integration with various data sources, platforms, and software, ensuring seamless data flow and interoperability.
- Benefit: Enhances the comprehensiveness and cohesiveness of environmental monitoring systems by integrating diverse data streams.
Example:
An environmental engineering firm uses cloud-based big data platforms to aggregate and analyze data from thousands of IoT sensors monitoring air quality across multiple cities. Machine learning algorithms process the data in real time to identify pollution trends, predict future air quality issues, and provide actionable recommendations to policymakers for improving air standards.
Conclusion: Cloud computing and big data technologies are invaluable assets in managing and analyzing large volumes of environmental data. Their scalability, cost-effectiveness, advanced analytical capabilities, and enhanced data accessibility significantly improve the efficiency and effectiveness of environmental monitoring efforts. By leveraging these technologies, environmental engineers can gain deeper insights, make informed decisions, and develop innovative solutions to address complex environmental challenges, ultimately contributing to more sustainable and resilient ecosystems.
9. How can the integration of Geographic Information Systems (GIS) with environmental monitoring data enhance spatial analysis and decision-making in environmental engineering projects?
Answer:
Integrating Geographic Information Systems (GIS) with environmental monitoring data significantly enhances spatial analysis and decision-making in environmental engineering projects by providing comprehensive tools for visualizing, analyzing, and interpreting spatial relationships and patterns within environmental data.
Enhancements Through Integration:
Comprehensive Data Visualization:
- Function: Combines spatial data with environmental monitoring data to create detailed maps and visual representations.
- Benefit: Facilitates the understanding of spatial distributions and relationships, making complex data more accessible and interpretable.
Advanced Spatial Analysis:
- Function: Enables complex analyses such as overlaying different environmental layers, spatial interpolation, and hotspot identification.
- Benefit: Allows engineers to identify correlations, causations, and spatial dependencies, supporting more informed and effective decision-making.
Real-Time Monitoring and Mapping:
- Function: Integrates real-time monitoring data with GIS to provide up-to-date spatial visualizations and alerts.
- Benefit: Supports timely responses to environmental changes, such as identifying pollution sources or tracking the spread of contaminants.
Scenario Modeling and Simulation:
- Function: Uses GIS to model and simulate various environmental scenarios based on monitoring data.
- Benefit: Assists in predicting the outcomes of different engineering interventions, evaluating their potential impacts, and selecting the most sustainable and effective solutions.
Resource Allocation and Optimization:
- Function: Analyzes spatial data to optimize the allocation of resources for environmental management and remediation efforts.
- Benefit: Ensures that resources are directed to areas of highest need or greatest impact, enhancing the efficiency and effectiveness of projects.
Stakeholder Communication and Engagement:
- Function: Utilizes GIS-based maps and visualizations to communicate complex environmental data and project findings to stakeholders clearly and effectively.
- Benefit: Enhances stakeholder understanding and engagement, fostering collaboration and support for environmental engineering initiatives.
Applications in Environmental Engineering Projects:
Pollution Source Identification:
- Application: Mapping pollution levels across different regions to identify hotspots and potential sources of contaminants.
- Benefit: Enables targeted remediation efforts and the implementation of pollution control measures in affected areas.
Habitat and Biodiversity Mapping:
- Application: Mapping the distribution of various species and habitats to assess biodiversity and identify critical conservation areas.
- Benefit: Supports the design of conservation strategies and the protection of vulnerable ecosystems.
Flood Risk Assessment:
- Application: Combining hydrological data with topographical maps to model flood-prone areas and assess flood risks.
- Benefit: Informs the design of flood mitigation infrastructure and emergency response plans.
Urban Planning and Development:
- Application: Integrating land use data with environmental monitoring information to guide sustainable urban development and zoning decisions.
- Benefit: Promotes the creation of environmentally friendly and resilient urban spaces.
Climate Change Impact Studies:
- Application: Analyzing climate data spatially to understand the impacts of climate change on different regions and ecosystems.
- Benefit: Aids in the development of climate adaptation and mitigation strategies tailored to specific geographic areas.
Example:
An environmental engineering project aiming to restore a polluted river integrates GIS with water quality monitoring data. By mapping pollutant concentrations and overlaying land use patterns, engineers identify agricultural runoff as a primary pollution source. GIS-based spatial analysis helps design targeted buffer zones and implement best management practices to reduce runoff and improve water quality.
Conclusion: Integrating Geographic Information Systems (GIS) with environmental monitoring data profoundly enhances spatial analysis and decision-making in environmental engineering projects. This integration enables comprehensive visualization, advanced spatial analysis, real-time monitoring, scenario modeling, optimized resource allocation, and effective stakeholder communication. By leveraging GIS, environmental engineers can develop more informed, strategic, and sustainable solutions to complex environmental challenges, ultimately contributing to the protection and restoration of ecosystems.
10. How can engineers address data gaps and inconsistencies in environmental monitoring datasets to ensure comprehensive and accurate environmental assessments?
Answer:
Addressing data gaps and inconsistencies in environmental monitoring datasets is crucial for conducting comprehensive and accurate environmental assessments. Engineers can employ various strategies and methodologies to identify, mitigate, and rectify these issues, ensuring the reliability and completeness of environmental data.
Strategies to Address Data Gaps and Inconsistencies:
Comprehensive Sampling Design:
- Strategy: Develop a robust sampling plan that ensures adequate spatial and temporal coverage, considering all relevant environmental variables and areas.
- Implementation: Use stratified sampling, random sampling, or systematic sampling techniques to distribute monitoring efforts evenly across different regions and times.
- Benefit: Reduces the likelihood of significant data gaps by ensuring that all critical areas and time periods are adequately covered.
Utilization of Remote Sensing and Satellite Data:
- Strategy: Supplement ground-based monitoring with remote sensing data to fill spatial and temporal gaps.
- Implementation: Integrate satellite imagery, aerial photography, and drone-based data collection with traditional monitoring methods.
- Benefit: Provides comprehensive coverage of large and inaccessible areas, enhancing the completeness of datasets.
Data Imputation and Interpolation Techniques:
- Strategy: Use statistical methods to estimate missing data points based on available data.
- Implementation: Apply techniques such as linear interpolation, kriging, or machine learning-based imputation to predict missing values.
- Benefit: Enhances dataset completeness and allows for continuous data analysis despite gaps.
Regular Calibration and Maintenance of Monitoring Equipment:
- Strategy: Ensure that monitoring instruments are regularly calibrated and maintained to prevent data inconsistencies and equipment failures.
- Implementation: Schedule routine calibration checks, perform preventive maintenance, and promptly address any technical issues.
- Benefit: Maintains data accuracy and consistency, reducing the occurrence of erroneous or missing data due to equipment malfunctions.
Redundant Monitoring Systems:
- Strategy: Deploy multiple sensors or monitoring stations in critical areas to provide backup data in case of sensor failure or data loss.
- Implementation: Use overlapping sensor networks and redundancy protocols to ensure continuous data collection.
- Benefit: Minimizes data gaps caused by single-point failures and enhances data reliability.
Implementing Automated Data Quality Control:
- Strategy: Use automated systems to continuously monitor data quality and detect anomalies or inconsistencies in real time.
- Implementation: Develop algorithms and software that flag outliers, inconsistencies, and potential errors for further review.
- Benefit: Allows for timely identification and correction of data issues, maintaining dataset integrity.
Cross-Validation with Independent Data Sources:
- Strategy: Validate environmental data by comparing it with independent datasets or alternative measurement methods.
- Implementation: Use secondary data sources such as academic research, government reports, or third-party monitoring programs for cross-validation.
- Benefit: Enhances data reliability and accuracy by ensuring consistency across different data sources.
Engaging Stakeholders and Community Participation:
- Strategy: Involve local communities and stakeholders in data collection and monitoring efforts to increase data coverage and fill gaps.
- Implementation: Implement citizen science programs, community-based monitoring, and collaborative data collection initiatives.
- Benefit: Expands data collection efforts, providing additional data points and increasing the comprehensiveness of environmental assessments.
Adaptive Monitoring Programs:
- Strategy: Design monitoring programs that can adapt to changing environmental conditions and emerging data needs.
- Implementation: Use flexible monitoring frameworks that allow for the addition or modification of monitoring sites and parameters as required.
- Benefit: Ensures that monitoring programs remain relevant and comprehensive in the face of evolving environmental challenges.
Data Integration and Synthesis:
- Strategy: Integrate diverse datasets from multiple sources to create a more complete and coherent picture of environmental conditions.
- Implementation: Use data integration platforms and databases that support the merging of different data types and sources.
- Benefit: Provides a holistic view of the environment, compensating for gaps and inconsistencies in individual datasets.
Example:
In a river health monitoring project, engineers notice gaps in water quality data during dry seasons. To address this, they integrate satellite-derived water temperature data and deploy additional sensors in previously unmonitored upstream areas. They also apply kriging interpolation to estimate missing pollutant concentrations, ensuring a comprehensive and continuous dataset for accurate environmental assessments.
Conclusion: Addressing data gaps and inconsistencies in environmental monitoring requires a multifaceted approach that includes strategic sampling, technological integration, statistical techniques, equipment maintenance, redundancy, automated quality control, cross-validation, stakeholder engagement, adaptive monitoring, and data integration. By implementing these strategies, engineers can ensure that environmental monitoring datasets are comprehensive, accurate, and reliable, supporting effective environmental assessments and informed decision-making.
10. How can data interoperability standards facilitate the integration of diverse environmental datasets, and what are the benefits of achieving seamless data interoperability in environmental engineering projects?
Answer:
Data interoperability standards are frameworks and protocols that enable different data systems and formats to communicate, share, and utilize data seamlessly. In environmental engineering projects, achieving data interoperability is essential for integrating diverse datasets from various sources, enhancing the efficiency and effectiveness of data analysis and decision-making.
Facilitation of Integration:
Standardized Data Formats:
- Function: Establish common data structures and formats (e.g., JSON, XML, CSV) that allow different systems to interpret and use data consistently.
- Benefit: Ensures compatibility between datasets from different sensors, platforms, and organizations, enabling smooth data exchange and aggregation.
Common Metadata Standards:
- Function: Define standardized metadata schemas that describe the context, quality, and structure of datasets.
- Benefit: Enhances data discoverability, usability, and comparability by providing consistent descriptions of data sources and attributes.
APIs and Data Sharing Protocols:
- Function: Develop application programming interfaces (APIs) and protocols (e.g., OGC standards) that facilitate automated data sharing and integration.
- Benefit: Enables real-time data exchange and interoperability between disparate systems, supporting dynamic and collaborative data usage.
Semantic Standards and Ontologies:
- Function: Utilize standardized vocabularies and ontologies to ensure that data meanings are consistently understood across different systems.
- Benefit: Prevents misinterpretation of data by aligning terminologies and concepts, enabling accurate data integration and analysis.
Data Governance Frameworks:
- Function: Implement policies and practices that ensure data quality, security, and compliance with interoperability standards.
- Benefit: Promotes trust and reliability in integrated datasets, ensuring that data can be effectively used for decision-making.
Benefits of Seamless Data Interoperability:
Enhanced Data Accessibility and Sharing:
- Benefit: Facilitates easy access to a wide range of datasets, promoting collaboration among environmental engineers, researchers, and stakeholders.
- Impact: Accelerates the development of comprehensive environmental assessments and solutions by leveraging diverse data sources.
Improved Data Quality and Consistency:
- Benefit: Ensures that integrated datasets are consistent, accurate, and reliable, reducing errors and enhancing the validity of analyses.
- Impact: Leads to more robust and credible environmental engineering outcomes, supporting effective decision-making and policy development.
Increased Efficiency and Reduced Redundancy:
- Benefit: Eliminates the need for manual data conversion and duplication, saving time and resources.
- Impact: Streamlines data workflows, allowing engineers to focus on analysis and application rather than data management.
Facilitated Comprehensive Analysis:
- Benefit: Enables the combination of diverse datasets (e.g., air quality, water quality, land use) for holistic environmental analysis.
- Impact: Provides a more complete understanding of environmental systems, supporting integrated and multifaceted engineering solutions.
Support for Advanced Technologies:
- Benefit: Enhances the effectiveness of machine learning, artificial intelligence, and big data analytics by providing well-integrated and standardized datasets.
- Impact: Unlocks new possibilities for predictive modeling, trend analysis, and innovative environmental engineering applications.
Scalability and Adaptability:
- Benefit: Allows environmental monitoring systems to scale and adapt by easily incorporating new data sources and technologies.
- Impact: Ensures that environmental engineering projects remain flexible and can evolve with emerging data needs and technological advancements.
Example:
An environmental engineering project aiming to assess urban air quality can integrate data from satellite remote sensing, ground-based sensor networks, and traffic monitoring systems using standardized data formats and metadata. This seamless integration allows for comprehensive analysis of pollution sources, dispersion patterns, and the effectiveness of mitigation measures.
Conclusion: Data interoperability standards are crucial for integrating diverse environmental datasets, enabling seamless data sharing, enhancing data quality, and supporting comprehensive analysis in environmental engineering projects. Achieving data interoperability fosters collaboration, increases efficiency, and facilitates the use of advanced technologies, ultimately leading to more effective and informed environmental management and engineering solutions.
11. What are some emerging technologies in ecological engineering, and how do they enhance the effectiveness of ecological restoration and sustainability projects?
Answer:
Emerging technologies in ecological engineering are revolutionizing the way ecological restoration and sustainability projects are designed, implemented, and managed. These technologies enhance the effectiveness of such projects by providing advanced tools for data collection, analysis, design, and monitoring, enabling more precise, efficient, and sustainable interventions.
Emerging Technologies:
Remote Sensing and UAVs (Drones):
- Description: Utilize satellite imagery and drone-based sensors to collect high-resolution spatial and temporal data.
- Enhancements:
- Precision Mapping: Provides detailed maps of ecosystems, identifying areas that require restoration.
- Monitoring: Facilitates ongoing monitoring of restoration progress and the health of ecosystems.
3D Printing and Advanced Manufacturing:
- Description: Use 3D printing technology to create customized habitat structures and bio-based materials.
- Enhancements:
- Habitat Structures: Produces complex structures that mimic natural habitats, supporting diverse
species and promoting biodiversity. – Erosion Control: Creates biodegradable materials for shoreline stabilization and soil reinforcement, reducing environmental impact.
Biotechnologies and Genetic Engineering:
- Description: Employ genetic engineering and biotechnological tools to enhance the resilience and functionality of plant and microbial species.
- Enhancements:
- Phytoremediation: Develops plants with enhanced capabilities to absorb and degrade pollutants, improving soil and water quality.
- Climate-Resilient Species: Creates plant varieties that are more tolerant to extreme weather conditions, supporting ecosystem resilience.
Artificial Intelligence and Machine Learning:
- Description: Apply AI and machine learning algorithms to analyze large datasets and optimize ecological engineering projects.
- Enhancements:
- Predictive Modeling: Predicts ecosystem responses to restoration efforts, enabling proactive management.
- Optimization: Enhances the design and implementation of restoration projects by identifying the most effective strategies based on data analysis.
Smart Sensors and IoT Integration:
- Description: Deploy smart sensors connected through the Internet of Things (IoT) to monitor environmental parameters in real time.
- Enhancements:
- Real-Time Monitoring: Provides continuous data on ecosystem health, enabling timely interventions.
- Adaptive Management: Allows for dynamic adjustments to restoration practices based on real-time data feedback.
Virtual and Augmented Reality:
- Description: Use VR and AR technologies to visualize restoration projects and simulate ecological scenarios.
- Enhancements:
- Design Visualization: Enables stakeholders to experience and evaluate restoration designs before implementation.
- Training and Education: Provides immersive training environments for educating engineers and community members about restoration techniques.
Biomimicry and Nature-Inspired Design:
- Description: Incorporate principles of biomimicry to design systems that emulate natural processes and structures.
- Enhancements:
- Efficient Systems: Creates sustainable and efficient ecological engineering solutions by mimicking natural efficiencies.
- Resilient Designs: Develops systems that are inherently resilient by drawing inspiration from the robustness of natural ecosystems.
Energy-Efficient and Renewable Technologies:
- Description: Integrate renewable energy sources and energy-efficient technologies into ecological engineering projects.
- Enhancements:
- Sustainable Operations: Reduces the carbon footprint of restoration projects by utilizing renewable energy.
- Self-Sustaining Systems: Develops projects that can operate independently of external energy sources, enhancing sustainability.
Example:
An ecological engineering project aiming to restore a degraded wetland utilizes drone-based remote sensing to map vegetation cover and soil conditions. AI algorithms analyze the collected data to identify optimal planting locations and species. 3D-printed habitat structures are installed to support wildlife, while smart sensors monitor water quality and habitat health in real time, allowing for adaptive management and ensuring the long-term success of the restoration effort.
Conclusion: Emerging technologies in ecological engineering significantly enhance the effectiveness of ecological restoration and sustainability projects by providing advanced tools for data collection, analysis, design, and monitoring. These technologies enable more precise, efficient, and sustainable interventions, supporting the restoration of ecosystems and the promotion of biodiversity. By embracing these innovations, ecological engineers can develop more resilient and impactful projects that contribute to environmental sustainability and ecosystem health.
12. What are some innovative data visualization techniques used in environmental monitoring, and how do they improve the interpretation and communication of environmental data?
Answer:
Innovative data visualization techniques in environmental monitoring transform complex and voluminous datasets into intuitive and actionable visual formats. These techniques enhance the interpretation and communication of environmental data by making it more accessible, understandable, and engaging for diverse audiences, including scientists, policymakers, and the general public.
Innovative Data Visualization Techniques:
Interactive Dashboards:
- Description: Dynamic platforms that display multiple data visualizations in real time, allowing users to interact with and explore data through filters, zooms, and selections.
- Improvements:
- Customization: Users can tailor the view to focus on specific parameters or regions of interest.
- Real-Time Updates: Provides up-to-date information, facilitating timely decision-making.
Geospatial Heat Maps:
- Description: Color-coded maps that represent the intensity or concentration of environmental variables across different geographic areas.
- Improvements:
- Spatial Pattern Identification: Highlights hotspots and spatial trends, making it easier to identify areas of concern.
- Visual Impact: Uses color gradients to convey complex data intuitively, enhancing comprehension.
Time-Lapse Visualizations:
- Description: Animated sequences that show changes in environmental parameters over time.
- Improvements:
- Trend Visualization: Clearly illustrates temporal trends and dynamic changes, such as seasonal variations or long-term shifts.
- Engagement: Creates visually compelling narratives that capture attention and facilitate understanding of temporal processes.
3D Surface Plots and Terrain Models:
- Description: Three-dimensional representations of environmental data, such as topography, pollutant dispersion, or vegetation density.
- Improvements:
- Depth Perception: Provides a more realistic and detailed view of spatial data, enhancing the interpretation of complex relationships.
- Comprehensive Analysis: Allows for the examination of multiple dimensions simultaneously, supporting more thorough analyses.
Bubble Charts and Scatter Plots:
- Description: Plots that use bubbles or points to represent data points, often with additional variables encoded through size, color, or position.
- Improvements:
- Multivariate Representation: Enables the visualization of multiple variables at once, revealing correlations and interactions.
- Clarity: Simplifies the comparison of data points, making patterns and outliers more apparent.
Story Maps:
- Description: Combines maps with narrative text, images, and multimedia elements to tell a cohesive story about environmental data and findings.
- Improvements:
- Contextualization: Provides context and explanations alongside spatial data, enhancing understanding.
- Narrative Flow: Guides viewers through a logical sequence of information, making complex data more relatable and memorable.
Dynamic Infographics:
- Description: Interactive and animated infographics that present key data points and trends in an engaging format.
- Improvements:
- Interactivity: Allows users to engage with the data by clicking, hovering, and exploring different aspects.
- Visual Appeal: Uses creative design elements to capture attention and simplify complex information.
Virtual Reality (VR) and Augmented Reality (AR) Visualizations:
- Description: Immersive technologies that allow users to explore environmental data in a virtual or augmented 3D space.
- Improvements:
- Immersive Experience: Provides a hands-on and intuitive understanding of spatial and environmental data.
- Enhanced Interpretation: Facilitates the exploration of data from multiple perspectives, improving comprehension of complex spatial relationships.
Sankey Diagrams:
- Description: Flow diagrams that visualize the movement of resources or pollutants through different stages or components of an ecosystem.
- Improvements:
- Flow Representation: Clearly shows the direction and magnitude of flows, making it easy to trace the pathways of environmental variables.
- Efficiency Highlighting: Identifies major pathways and potential bottlenecks or sources of loss.
Word Clouds and Tag Clouds:
- Description: Visual representations that display the frequency or significance of words or terms related to environmental data.
- Improvements:
- Quick Insights: Provides a quick overview of key themes and topics in qualitative environmental data.
- Visual Simplicity: Simplifies the presentation of textual data, making it easier to identify prominent terms.
Benefits of Innovative Visualization Techniques:
Enhanced Data Interpretation:
- Benefit: Makes complex and large datasets more understandable by highlighting key patterns, trends, and relationships.
- Impact: Facilitates deeper insights and more accurate interpretations of environmental data.
Improved Communication:
- Benefit: Transforms raw data into visually appealing formats that are easier to communicate to non-experts and stakeholders.
- Impact: Enhances stakeholder engagement, supports informed decision-making, and fosters collaborative problem-solving.
Increased Accessibility:
- Benefit: Makes environmental data accessible to a wider audience, including policymakers, educators, and the public.
- Impact: Promotes transparency, education, and public participation in environmental management initiatives.
Support for Decision-Making:
- Benefit: Provides clear and actionable visual insights that inform strategic planning and policy development.
- Impact: Enhances the effectiveness and efficiency of environmental engineering projects by guiding data-driven decisions.
Engagement and Motivation:
- Benefit: Engaging visualizations capture attention and motivate users to explore and interact with the data.
- Impact: Encourages active participation and interest in environmental monitoring and conservation efforts.
Example:
A story map documenting the impact of deforestation in a rainforest region uses satellite imagery, charts of tree cover loss over time, and narrative descriptions of ecological consequences. Interactive elements allow users to explore different areas and time periods, providing a comprehensive and engaging overview of the issue.
Conclusion: Innovative data visualization techniques play a crucial role in enhancing the interpretation and communication of environmental data. By transforming complex datasets into intuitive and engaging visual formats, these techniques facilitate deeper understanding, effective communication, informed decision-making, and increased public engagement in environmental engineering projects. Leveraging these advanced visualization methods enables environmental engineers to convey critical information more effectively, supporting the development of sustainable and impactful environmental solutions.
Conclusion: The above thought-provoking questions and detailed answers provide a comprehensive exploration of environmental monitoring and data analysis within environmental engineering. Covering fundamental concepts, technological advancements, ethical considerations, interdisciplinary collaboration, and innovative visualization techniques, these inquiries encourage students to critically analyze and engage with the complexities of environmental data management. By delving into topics such as real-time data acquisition, citizen science integration, sensor technology, data interoperability, big data ethics, and advanced analytical tools, students are equipped with the knowledge and critical thinking skills necessary to excel in the field of environmental engineering and contribute effectively to sustainable environmental management and protection.