
Quality education begins with a simple, uncomfortable truth: a product can look perfect and still be wrong. This diagram shows how learners are trained to close that gap between appearance and evidence. The inputs—standards and industry practices—give students two anchors: the formal definition of acceptability, and the lived realities that make quality difficult (noise in measurements, variation in materials, human mistakes, time pressure). The controls—curriculum requirements and evaluation metrics—keep the training precise, insisting that students can demonstrate judgment rather than merely talk about it. Inside the central function, learners practice a new kind of thinking: they learn to treat variation as information, to separate signal from noise, and to ask whether a process is capable—not just whether today’s sample passed. The mechanisms—measurement tools and statistical software—turn quality into something observable and discussable, where decisions can be justified with data instead of authority. The outputs follow naturally: trained inspectors who can see problems early and communicate them clearly, and improved products that earn trust because their quality is designed, measured, and continuously strengthened—not wished into existence.
- Statistical Process Control & Process Capability: Shewhart control charts (\(\bar{X}\text{-}R\)), Western Electric anomaly detection rules, and capability indices (\(C_p\), \(C_{pk}\)) evaluating sub-millimeter precision.
- Defect Risk Modeling & Six Sigma DMAIC: Quantitative failure mode prioritization via Failure Modes and Effects Analysis (\(\text{FMEA}\) Risk Priority Numbers), Defects Per Million Opportunities (\(\text{DPMO}\)), and Rolled First Pass Yield (\(\text{RTY}\)).
- Industry 4.0 Closed-Loop Quality Assurance: Real-time Computer Vision surface defect segmentation, digital Coordinate Measuring Machines (CMM), inline acoustic emission monitoring, and Physics-Informed Neural Networks (PINNs) for zero-defect automated feedback.
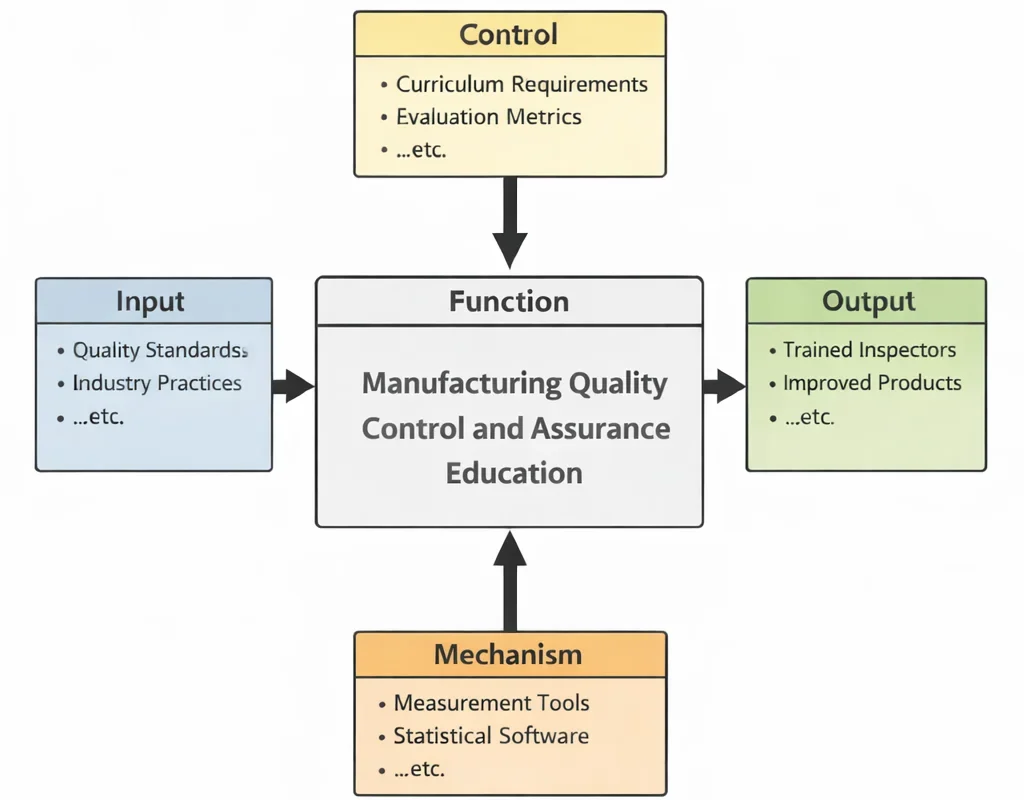
This IDEF0 (Input–Control–Output–Mechanism) diagram summarizes Manufacturing Quality Control and Assurance Education as a structured training system. Inputs on the left—quality standards and industry practices—provide the reference expectations and real operating context for what “good” looks like. Controls at the top—curriculum requirements and evaluation metrics—define what learners must master and how competence is measured. The central function, Manufacturing Quality Control and Assurance Education, transforms these inputs and controls into teachable methods for inspection, verification, and quality management. Outputs on the right—trained inspectors and improved products—represent the desired educational results, emphasizing consistent performance and reduced defects. Mechanisms at the bottom—measurement tools and statistical software—support hands-on learning, enabling students to collect data, analyze variation, and make evidence-based quality decisions.
Manufacturing quality control and assurance form the backbone of consistent, safe, and reliable industrial production. In a competitive manufacturing environment, delivering defect-free products that meet customer specifications is not only a strategic advantage but also a regulatory necessity. Rooted in the broader field of Industrial and Manufacturing Technologies, this discipline blends rigorous inspection methods with system-wide process monitoring to identify, correct, and prevent errors throughout the production cycle.
The evolution of quality assurance has paralleled the rise of digital tools. For instance, Digital Twin Technology allows manufacturers to simulate real-world performance, identifying potential issues before physical production begins. Similarly, Computer-Integrated Manufacturing (CIM) enables end-to-end digital oversight of machining, assembly, and testing processes.
Attention to materials is critical, especially with the adoption of Advanced Materials and Manufacturing Technologies and novel techniques such as Additive Manufacturing (3D Printing). Quality professionals must develop new inspection standards to evaluate mechanical strength, porosity, and microstructure. These innovations are central to Smart Manufacturing and Industry 4.0, which emphasizes data-driven feedback loops and real-time defect detection.
An effective quality framework supports other operational pillars, including Lean Manufacturing, which focuses on eliminating waste while maintaining output standards. Similarly, Sustainable Manufacturing integrates environmentally sound practices without compromising product performance. These goals are often realized through meticulous Energy and Resource Efficiency in Manufacturing.
Incorporating human oversight remains essential. The study of Human Factors and Ergonomics in Manufacturing ensures that inspection tasks are performed reliably and safely. Meanwhile, advances in Industrial Automation and Robotics automate precision testing and visual inspection in high-volume production lines.
Process design has a direct impact on quality. Seamless integration of design practices covered under Mechanical Design and CAD with robust Supply Chain Management ensures traceability and defect prevention across the entire value chain. These approaches complement topics in Manufacturing Process Design and Optimization.
The relevance of quality assurance spans many domains. Applications range from Automotive Engineering, where tight tolerances affect safety, to high-stakes fields like Biomechanical Engineering, where small flaws can jeopardize human health. Supportive knowledge from Solid Mechanics, Fluid Mechanics and Hydraulics, and Thermodynamics and Heat Transfer enhances the analytical rigor behind quality measurements.
Underlying many of these efforts are essential engineering foundations. Subjects such as Control Systems in Mechanical Engineering ensure that manufacturing conditions stay within optimal boundaries. Advanced fabrication techniques are also supported by insights from Nanotechnology and Advanced Materials in Mechanical Engineering and Robotics and Automation in Mechanical Engineering.
Ultimately, the pursuit of quality is not an isolated activity, but a continuous loop of measurement, feedback, and improvement across all levels of production. A solid grounding in quality control and assurance prepares students to uphold standards in a manufacturing world that demands precision, consistency, and trustworthiness.

Ensuring Product Integrity: Standards, Testing, and Continuous Improvement
Navigate through the core topics of Industrial & Manufacturing Technologies to see how quality control and assurance interacts across different manufacturing domains:
Industrial & Manufacturing Technologies Overview
Connects quality assurance with overall manufacturing performance, system reliability, and overall industrial framework alignment.
Quality Control & Assurance (Current)
Implements SPC testing, automated monitoring, and ISO/IATF standards to ensure products meet required dimensional and functional specifications.
Process Design & Optimization
Establishes stable manufacturing process windows that enable consistent defect-free quality output.
Lean Manufacturing
Reduces scrap defects and process inefficiencies through poka-yoke error proofing and root cause analysis.
Smart Manufacturing
Uses real-time IoT sensor telemetry and computer vision analytics to maintain inline product quality.
Digital Twin Technology
Simulates physical quality performance and predicts component stress limits virtually before physical fabrication.
Automation & Robotics
Enhances inspection speed and repeatability by deploying vision-guided robotic testing stations.
Computer-Integrated Manufacturing
Integrates SPC inspection logs and automated CMM feedback directly into shop floor MES control systems.
Additive Manufacturing
Introduces specialized non-destructive inspection techniques like micro-CT scanning for 3D printed porosity verification.
Advanced Materials
Requires specialized ultrasonic and thermal validation testing for advanced composite structures.
Supply Chain Management
Enforces incoming material supplier quality agreements and full lot traceability across distribution networks.
Sustainable Manufacturing
Ensures zero-defect quality goals align with reduced scrap material generation and lower environmental impact.
Energy Efficiency
Prevents energy-intensive rework and scrap processing by stabilizing machine thermal parameter windows.
Human Factors
Minimizes visual inspection fatigue and human measurement errors through ergonomic testing bench design.
Core Concepts of Quality Control and Assurance
Effective quality management in manufacturing depends on two foundational pillars: Quality Control (QC) and Quality Assurance (QA). These complementary practices ensure that both products and the processes that create them consistently meet or exceed customer expectations. While QC focuses on identifying and fixing defects in outputs, QA emphasizes building defect prevention into the production system itself. Understanding and applying both concepts is essential for achieving consistent performance, reducing waste, and enhancing customer trust.
Quality Control (QC)
- Definition: Quality Control is a reactive process dedicated to identifying and rectifying nonconformities in final products or during key stages of production. It serves as the last line of defense before products reach the customer, ensuring that defective units are detected and either corrected or rejected.
- Key Activities:
- Regular inspections and testing: Performed on incoming materials, in-process units, and finished goods to assess conformity to design specifications and industry standards.
- Sampling techniques: Statistical sampling is used to efficiently inspect large batches of products without testing every item, balancing inspection accuracy with throughput requirements.
- Implementing corrective actions: When deviations are identified, immediate responses such as rework, adjustments, or process halts are initiated to maintain overall product quality.
- Focus Areas: Defect detection and verification of conformance to criteria before dispatch.
Quality Assurance (QA)
- Definition: Quality Assurance is a proactive and systematic approach focused on building quality into processes from the beginning. It aims to prevent defects by establishing, auditing, and improving process controls, documentation, and organizational practices.
- Key Activities:
- Developing SOPs (Standard Operating Procedures): Defining best practices and expected performance for every critical task, ensuring consistency across shifts and operators.
- Conducting audits and assessments: Monitoring process capability and compliance with established standards through periodic reviews, internal audits, and capability studies (\(C_p\) and \(C_{pk}\) analysis).
- Risk management: Proactively identifying potential failure modes and introducing mistake-proofing mechanisms (poka-yoke) or automated verification loops.
- Focus Areas: Process design reliability, variation reduction, and institutionalized continuous improvement, supported by the guidelines of the American Society for Quality (ASQ).
Comparative Architecture: QC versus QA
| System Dimension | Quality Control (QC) | Quality Assurance (QA) |
|---|---|---|
| Primary Focus | Detecting and filtering non-conforming product outputs. | Preventing defects through systemic process architecture design. |
| Operational Nature | Reactive (post-production or post-operation checkpoint). | Proactive (pre-production validation and closed-loop feedback). |
| Target Metric | Product defect count, scrap rate, and dimensional conformance. | Process stability, variance (\(\sigma\)), capability (\(C_{pk}\)), and SOP compliance. |
| Primary Tools | Gauges, calipers, CMM inspection, tensile testers, vision sorting. | FMEA, SPC control charts, ISO 9001 audits, DMAIC, poka-yoke fixtures. |
Contemporary Computational Metrology & Closed-Loop Quality Paradigms
Modern quality assurance has evolved beyond retrospective lot inspection into real-time, closed-loop computational metrology. By combining edge computer vision, automated coordinate measuring machines (CMM), and statistical neural models, intelligent factories detect and correct micro-scale deviations in real time.
Statistical Process Control (SPC) Mechanics & Capability Formulation
The statistical monitoring of continuous variables relies on Shewhart \(\bar{X}\text{-}R\) control charts. For subgroup samples of size \(n\), the Upper and Lower Control Limits (\(\text{UCL}\) and \(\text{LCL}\)) define the natural \(\pm 3\sigma_{\bar{X}}\) process spread:
$$\text{UCL}_{\bar{X}} = \bar{\bar{X}} + A_2 \bar{R}, \qquad \text{LCL}_{\bar{X}} = \bar{\bar{X}} - A_2 \bar{R}$$
Where \(\bar{\bar{X}}\) is the grand mean, \(\bar{R}\) is the average subgroup range, and \(A_2\) is a sample-size factor. Process capability is assessed relative to customer specification limits (\(\text{USL}\) and \(\text{LSL}\)):
$$C_p = \frac{\text{USL} - \text{LSL}}{6\sigma}, \qquad C_{pk} = \min\left( \frac{\text{USL} - \mu}{3\sigma}, \frac{\mu - \text{LSL}}{3\sigma} \right)$$
A value of \(C_{pk} \ge 1.33\) indicates a capable process, while \(C_{pk} \ge 1.67\) reflects a modern Six Sigma benchmark with defect rates \(\le 3.4\,\text{DPMO}\).
Physics-Informed Neural Networks (PINNs) in Optical Metrology & Defect Prediction
In high-speed microelectronics, additive sintering, and automotive stamping, vision systems generate dense point clouds containing millions of coordinates. To distinguish benign surface texture from structural micro-cracks, Physics-Informed Neural Networks (PINNs) incorporate stress-concentration differential formulations into the computer vision convolutional loss:
$$\mathcal{L}_{\text{total}} = \mathcal{L}_{\text{pixel}} + \lambda_{\text{stress}} \|\nabla \cdot \boldsymbol{\sigma} + \mathbf{b}\|^2 + \lambda_{\text{elast}} \|\boldsymbol{\sigma} - \mathbf{C} : \boldsymbol{\varepsilon}\|^2$$
Where \(\boldsymbol{\sigma}\) is the Cauchy stress tensor, \(\boldsymbol{\varepsilon}\) is the strain tensor, and \(\mathbf{C}\) is the fourth-order elasticity tensor. This ensures automated optical inspection (AOI) identifies micro-flaws that threaten fatigue life before non-destructive testing (NDT) can detect them.
Systems Engineering Trade-Off Matrix: Industrial Quality Architectures
Balancing quality requirements involves managing trade-offs among inspection frequency, cycle latency, tooling investment, and warranty risk:
| Quality Intervention | Primary Quality Advantage | Engineering Bottlenecks & Failure Modes | Design Mitigation Strategy |
|---|---|---|---|
| 100% Inline Automated Inspection | Zero escape rate for critical defects; real-time sorting of out-of-spec parts. | High capital expense for high-speed sensor cameras; false positive rejections slowing line takt time. | Deploy dual-threshold AI vision classifiers with automated secondary re-verification bins. |
| Statistical Sampling (AQL Lot Testing) | Low inspection labor cost; rapid batch release; minimal metrology hardware required. | Consumer risk (\(\beta\)-risk) of accepting defective lots; relies on assumption of stable underlying distribution. | Switch dynamically to tightened inspection regimes immediately upon observing non-random SPC runs. |
| Tightening Engineering Tolerances | Ensures precision assembly fit; reduces mechanical vibration and acoustic noise in end products. | Exponential escalation in machining costs; accelerated tool wear; high scrap rate on minor deviations. | Apply statistical tolerance stack-up analysis (RSS) instead of worst-case arithmetic summation. |
| Physical Poka-Yoke Fixtures | Guarantees error-free assembly; eliminates human visual oversight errors at zero recurring software cost. | Inflexible to minor part geometry revisions; mechanical pins subject to abrasive wear over time. | Construct locating pins from hardened tungsten carbide; integrate quick-change modular fixture plates. |
Key Practices in Quality Control and Assurance
Statistical Process Control (SPC)
Statistical Process Control uses real-time sampling and control charts to separate common cause noise from assignable special cause variation, triggering corrective interventions before non-conforming parts are produced.
Inspections and Testing
- Dimensional Metrology: Verifies geometric tolerances using Coordinate Measuring Machines (CMM), optical laser line scanners, and air gauging.
- Non-Destructive Testing (NDT): Inspects structural components for subsurface flaws via ultrasonic testing, eddy-current arrays, radiographic X-ray, and magnetic particle inspection without compromising part integrity.
- Functional Destructive Testing: Samples tensile yield strength, Charpy impact toughness, and fatigue life under simulated operational stresses.
Quality Management Systems (QMS) & Standards
Comprehensive QMS frameworks—such as ISO 9001 (General Manufacturing), IATF 16949 (Automotive), AS9100 (Aerospace), and ISO 13485 (Medical Devices)—enforce documented standard operating procedures, internal audit schedules, calibration records, and full lot traceability across international supply chains.
Failure Modes and Effects Analysis (FMEA) & Six Sigma DMAIC
FMEA quantitatively evaluates potential engineering risks by computing a Risk Priority Number (\(\text{RPN} = S \times O \times D\)). Six Sigma complements FMEA through the structured DMAIC (Define, Measure, Analyze, Improve, Control) problem-solving roadmap, systematically eliminating sources of process variance.
Applications of Quality Control Systems in Manufacturing
About This Interactive Simulator:
This interactive Statistical Process Control (SPC) simulator tracks \(\bar{X}\) sample mean variations and process capability indices (\(C_p\) and \(C_{pk}\)) against upper and lower specification limits. Adjust the process mean and standard deviation to evaluate real-time stability and out-of-control conditions.
- Solid Cyan Line: Sample batch mean measurements across sequential production runs.
- Dashed Rose Lines: Upper and Lower Specification Limits (\(\text{USL} = 10.050\,\text{mm}\), \(\text{LSL} = 9.950\,\text{mm}\)).
- Interactive Sliders: Modulate Process Mean (\(9.940\text{--}10.060\,\text{mm}\)), Process Standard Deviation (\(0.005\text{--}0.030\,\text{mm}\)), and Subgroup Sample Size (\(2\text{--}10\)).
Interactive SPC X-bar Chart & Capability Simulator
Benefits of Quality Control and Assurance
- Enhanced Customer Satisfaction: Consistently delivering high-quality products directly strengthens brand perception and customer retention. Rigorous testing and proactive defect prevention ensure customer feedback loops drive continuous improvement.
- Substantial Cost Reduction: Catching non-conformances early through preventive measures minimizes internal scrap, rework, and warranty liabilities, leading to substantial savings. The American Society for Quality (ASQ) notes that organizations save millions annually by controlling cost of quality proactively.
- Strengthened Brand Reputation: Consistent adherence to strict quality benchmarks differentiates manufacturers in competitive markets, building customer and investor confidence in organizational excellence.
- Regulatory Compliance: QMS frameworks ensure audited compliance with international regulations such as ISO 9001, FDA cGMP, and IATF 16949, preventing regulatory penalties and enabling global supply chain access.
- Employee Empowerment: Frameworks like TQM and Kaizen empower shopfloor operators to identify inefficiencies, suggest process adjustments, and take ownership of product quality.
Challenges & Metrology Constraints in Implementation
- High Implementation & Metrology Capital Costs: Acquiring Coordinate Measuring Machines (CMM), optical laser scanners, automated X-ray inspection cells, and QMS software requires substantial capital, presenting hurdles for smaller enterprises.
- Cultural Resistance to Accountability: Frontline operators accustomed to legacy procedures may view stricter documentation, Gage R&R audits, and SPC tracking as punitive rather than supportive, requiring structured leadership coaching.
- Data Overload & Telemetry Fragmentation: High-frequency sensor streams from CMMs and IoT devices can overwhelm quality teams without contextual data governance and automated SPC alarm filtering.
- Global Supply Chain Traceability: Maintaining uniform material quality across overseas Tier-2 and Tier-3 suppliers requires rigorous vendor audits, supplier quality agreements, and standardized inspection protocols.
Emerging Trends in Quality Control and Assurance
- AI-Powered Computer Vision Inspection: Deep learning convolutional networks analyze surface finishes, solder menisci, and weld profiles in real time at full production speed.
- Zero-Defect Closed-Loop Manufacturing: Automated inspection stations feed dimensional offsets directly back to CNC machine tool controllers, dynamically adjusting tool wear offsets before parts exceed limits.
- Sustainability Metrics in QA: Quality audits integrate environmental KPIs—such as scrap carbon intensity and coolant reusability—aligning ISO 9001 quality systems with ISO 14001 sustainability targets.
- Predictive Metrology & Digital Twins: Physics-based digital twins simulate tool deflection and thermal expansion, predicting dimensional drift hours before it produces defective parts.
- Remote & Augmented Reality (AR) Quality Audits: Smart AR headsets allow remote lead auditors to inspect overseas vendor facilities, verify calibration certificates, and guide local technicians through non-conformance reviews.
Future Directions in Quality Control and Assurance
- Self-Regulating Autonomous Workcells: Intelligent machine cells will autonomously identify out-of-control statistical trends, execute diagnostic subroutines, and recalibrate actuators without human intervention.
- Process Analytical Technology (PAT) Expansion: Real-time chemical spectroscopy and acoustic emission tracking will enable continuous quality verification during synthesis, replacing post-batch testing.
- Cryptographic Blockchain Traceability: Immutable distributed ledgers will track raw material melt heats, heat treatment logs, and CMM dimensional certificates across complex aerospace supply chains.
- Personalized & Dynamic Quality Tolerancing: Quality metrics will dynamically adjust tolerance bands based on custom end-use requirements and simulated functional operating conditions.
- Multi-Scale Additive Metrology: High-speed synchrotron micro-CT scanning and thermal pyrometry will provide layer-by-layer defect detection during laser powder bed fusion (LPBF).
Why Study Manufacturing Quality Control and Assurance
Ensuring Consistent Product Quality
Quality control and assurance focus on meeting product specifications and customer expectations. Students learn how to detect defects, maintain standards, and reduce variability. This supports reliability and brand reputation.
Quality Tools and Statistical Methods
Students explore control charts, process capability analysis, and Six Sigma techniques. They learn how to use statistical tools to monitor performance and drive improvement. These methods ensure data-based decision-making.
Inspection, Testing, and Documentation
The course teaches how to conduct inspections and tests for materials, components, and final products. Students also learn the importance of documentation for traceability and compliance. This ensures accountability and transparency.
Quality Management Systems (QMS)
Students study systems like ISO 9001 and Total Quality Management (TQM). These frameworks provide structured approaches to managing and improving quality. Mastery of QMS is essential for regulatory and competitive success.
Customer Focus and Continuous Improvement
Quality assurance emphasizes customer satisfaction and long-term improvement. Students learn to collect feedback, resolve issues, and evolve processes. This enhances value delivery and organizational growth.
Quality Control and Assurance: Conclusion
Quality control (QC) and quality assurance (QA) represent more than operational necessities—they are strategic pillars that shape the trustworthiness, competitiveness, and long-term viability of organizations across all sectors. By embedding quality deeply into every process, from product design and sourcing to manufacturing and customer service, businesses can build resilient systems that consistently deliver high value to consumers and stakeholders.
Modern QC and QA practices leverage a diverse toolkit that includes well-established frameworks such as Six Sigma, Total Quality Management (TQM), and Statistical Process Control (SPC), all of which aim to eliminate defects, reduce variability, and ensure consistent outcomes. These methodologies help organizations move beyond reactive fixes toward predictive and preventive strategies that align with broader goals of efficiency and customer delight.
The role of technology in elevating quality practices cannot be overstated. With the integration of the Internet of Things (IoT), artificial intelligence (AI), and cloud-based platforms, real-time monitoring, automated inspections, and predictive analytics are revolutionizing how quality is managed. Smart sensors and machine learning algorithms allow manufacturers to detect anomalies before they lead to costly failures, while cloud-connected systems ensure data is accessible, traceable, and actionable across global supply chains.
In parallel, industry-specific standards such as ISO 9001, IATF 16949, and GMP ensure regulatory compliance and provide structured guidance for maintaining excellence in complex environments. These standards promote consistency, transparency, and accountability, which are increasingly important in an era of globalized trade, heightened customer expectations, and rigorous legal oversight.
Sustainability is also becoming a core theme in quality assurance. Organizations are not only expected to deliver defect-free products but also to ensure ethical sourcing, environmentally responsible production, and safe disposal or recyclability. This evolution broadens the scope of QA and introduces metrics such as carbon footprint, water usage, and lifecycle impact into traditional quality scorecards.
Furthermore, the workforce plays a critical role in sustaining quality initiatives. Empowering employees through training, feedback mechanisms, and cross-functional collaboration nurtures a culture where continuous improvement becomes second nature. Quality becomes everyone’s responsibility—from engineers and operators to executives and partners. As noted in an article from Harvard Business Review, strong leadership and organizational alignment are essential to driving quality transformations that stick.
In conclusion, quality control and assurance are not static checklists but dynamic disciplines that evolve with technological progress, regulatory landscapes, and market expectations. Organizations that embed quality into their DNA are better positioned to innovate, adapt, and thrive. As industries increasingly embrace digital transformation and sustainable development, QC and QA will remain indispensable tools for navigating complexity and achieving excellence in an ever-changing world.
Manufacturing Quality Control and Assurance: Frequently Asked Questions
This FAQ gathers the core questions students and practitioners often ask about quality systems in manufacturing, from basic concepts to modern digital tools.
1. What are the primary objectives of quality control and assurance in manufacturing?
2. How do Quality Control (QC) and Quality Assurance (QA) differ in their roles within the manufacturing process?
3. What are the key quality control tools used in manufacturing, and how do they contribute to quality improvement?
4. What is Statistical Process Control (SPC), and how is it applied in manufacturing quality assurance?
5. What is Total Quality Management (TQM), and how does it differ from traditional quality control methods?
6. How does Six Sigma methodology contribute to quality assurance in manufacturing?
7. What is the role of Total Productive Maintenance (TPM) in ensuring manufacturing quality?
8. How does ISO 9001 certification benefit manufacturing organizations in terms of quality assurance?
9. What are the key steps involved in implementing a Quality Management System (QMS) in a manufacturing facility?
10. How can Lean Manufacturing principles be integrated with Six Sigma to create a synergistic approach to quality improvement?
11. How can Manufacturing Execution Systems (MES) support quality control and assurance in manufacturing operations?
12. How does the integration of IoT technologies enhance the real-time monitoring and control of manufacturing processes?
Quality Control & Assurance Practice Modules
Section 1: Interactive Knowledge Self-Assessment
1. What is the fundamental difference between Quality Control (QC) and Quality Assurance (QA)?
2. How do process capability indices \(C_p\) and \(C_{pk}\) differ?
3. What three risk parameters are multiplied to calculate a Risk Priority Number (RPN) in FMEA?
4. How does an X-bar and R control chart detect special cause variation?
5. What defect rate corresponds to a Six Sigma process level?
6. Why is Non-Destructive Testing (NDT) vital in aerospace manufacturing?
7. How does a Pareto Analysis guide quality improvement prioritization?
8. What role does Corrective and Preventive Action (CAPA) play in ISO 9001 compliance?
Section 2: Analytical & Scenario-Based Case Studies
1. Scenario: An automotive stamping plant notices a sudden shift in door panel dimensions during the afternoon shift. How should SPC tools diagnose this?
2. Scenario: A medical device manufacturer experiences intermittent seal leaks on sterile pouch packaging. What DMAIC steps resolve this?
Measure: Record burst pressure and seal temperature data across 500 samples.
Analyze: Execute a DOE to evaluate sealing temperature, dwell time, and pressure interactions.
Improve: Set optimal thermal parameters and install automatic temperature interlocks.
Control: Implement real-time thermal sensor monitoring linked to an MES control chart.
3. Scenario: A PCB assembly plant suffers high solder bridging rates on surface-mount ICs. How can Automated Optical Inspection (AOI) integrated with AI resolve this?
4. Scenario: A commercial aircraft turbine blade forging line identifies internal porosity during ultrasonic testing. What FMEA corrective action applies?
5. Scenario: A pharmaceutical liquid filling line experiences fill volume variation beyond the ±1% threshold. How can 5 Whys RCA isolate the issue?
2. Why pressure drops? Check valve seat shows wear.
3. Why valve wear? Abrasive suspension cleaning solution used.
4. Why abrasive solution used? Unapproved cleaning SOP update.
5. Why unapproved SOP? Change management protocol was bypassed. Root cause: Inadequate QMS documentation control.
6. Scenario: A global food processor wants to prevent counterfeit olive oil blending across its international supply chain. How can blockchain QA help?
7. Scenario: A precision gear manufacturing plant incurs high scrap costs during initial morning warm-up runs. How can SPC and pre-heating resolve this?
Section 3: Mathematical & Quality Engineering Calculations
Work through these step-by-step mathematical calculations evaluating Process Capability (\(C_p\), \(C_{pk}\)), Shewhart control limits (\(\text{UCL}\), \(\text{LCL}\)), FMEA Risk Priority Numbers, Six Sigma Defect Metrics (\(\text{DPMO}\)), Rolled First Pass Yield (\(\text{RTY}\)), and Cost of Poor Quality (\(\text{COPQ}\)).
Problem 1: Process Capability Index (Cp) and Critical Capability (Cpk) Calculation
Problem Statement: A precision CNC shaft grinding process operates with specification limits \(\text{USL} = 25.030\,\text{mm}\) and \(\text{LSL} = 24.970\,\text{mm}\). Statistical sampling yields a process mean \(\mu = 25.008\,\text{mm}\) and sample standard deviation \(\sigma = 0.005\,\text{mm}\). Compute the potential process capability \(C_p\) and actual critical capability index \(C_{pk}\).
Step 1: Potential Capability (\(C_p\)) Evaluation
$$C_p = \frac{\text{USL} - \text{LSL}}{6\sigma} = \frac{25.030\,\text{mm} - 24.970\,\text{mm}}{6 \times 0.005\,\text{mm}} = \frac{0.060}{0.030} = \mathbf{2.00}$$
Step 2: Upper and Lower Directional Capabilities (\(C_{pu}\) and \(C_{pl}\))
$$C_{pu} = \frac{\text{USL} - \mu}{3\sigma} = \frac{25.030 - 25.008}{3 \times 0.005} = \frac{0.022}{0.015} \approx 1.467$$
$$C_{pl} = \frac{\mu - \text{LSL}}{3\sigma} = \frac{25.008 - 24.970}{3 \times 0.005} = \frac{0.038}{0.015} \approx 2.533$$
Step 3: Critical Process Capability (\(C_{pk}\)) Resolution
$$C_{pk} = \min(C_{pu}, C_{pl}) = \min(1.467, 2.533) = \mathbf{1.47}$$
Engineering Interpretation: The potential capability (\(C_p = 2.00\)) represents Six Sigma spread capability. However, because the mean is shifted \(+0.008\,\text{mm}\) above nominal center (\(25.000\,\text{mm}\)), actual capability is constrained to \(C_{pk} = 1.47\). Centering the tool offset will restore full Six Sigma performance.
Problem 2: Shewhart X-bar Control Limits Derivation
Problem Statement: An X-bar control chart is constructed using subgroup sample size \(n = 5\). Across \(20\) stable subgroups, grand mean \(\bar{\bar{X}} = 50.200\,\text{mm}\) and average range \(\bar{R} = 0.600\,\text{mm}\). For \(n = 5\), factor \(A_2 = 0.577\). Compute Upper Control Limit (\(\text{UCL}\)) and Lower Control Limit (\(\text{LCL}\)).
Step 1: Control Limit Band Calculation
$$A_2 \cdot \bar{R} = 0.577 \times 0.600\,\text{mm} = 0.3462\,\text{mm}$$
Step 2: Control Limit Boundary Resolution
$$\text{UCL}_{\bar{X}} = \bar{\bar{X}} + A_2 \bar{R} = 50.200 + 0.3462 = \mathbf{50.55\,\text{mm}} \quad (50.5462\,\text{mm})$$
$$\text{LCL}_{\bar{X}} = \bar{\bar{X}} - A_2 \bar{R} = 50.200 - 0.3462 = \mathbf{49.85\,\text{mm}} \quad (49.8538\,\text{mm})$$
Engineering Interpretation: These boundaries define the natural \(\pm 3\sigma_{\bar{X}}\) limits for sample averages of 5 parts. Any sample mean plotting outside \([49.85\,\text{mm}, 50.55\,\text{mm}]\) signals an assignable special cause requiring immediate line investigation.
Problem 3: FMEA Risk Priority Number (RPN) Reduction Analysis
Problem Statement: On an automated robotic spot welding cell, a potential failure mode (incomplete weld penetration) is assessed with Severity \(S = 8\), Occurrence \(O = 5\), and Detection \(D = 4\). A poka-yoke current transducer and ultrasonic weld checker are introduced, reducing Occurrence to \(O = 2\) and Detection to \(D = 2\). Determine initial \(\text{RPN}\), revised \(\text{RPN}\), and percentage risk abatement.
Step 1: Baseline RPN Evaluation
$$\text{RPN}_{\text{initial}} = S \times O \times D = 8 \times 5 \times 4 = \mathbf{160}$$
Step 2: Post-Mitigation RPN Evaluation
$$\text{RPN}_{\text{new}} = S \times O_{\text{new}} \times D_{\text{new}} = 8 \times 2 \times 2 = \mathbf{32}$$
Step 3: Risk Reduction Percentage
$$\Delta \text{Risk}_{\%} = \left( \frac{\text{RPN}_{\text{initial}} - \text{RPN}_{\text{new}}}{\text{RPN}_{\text{initial}}} \right) \times 100\% = \left( \frac{160 - 32}{160} \right) \times 100\% = \frac{128}{160} \times 100\% = \mathbf{80.0\%}$$
Engineering Interpretation: The poka-yoke and ultrasonic inspection intervention eliminates \(80.0\%\) of the systemic failure risk, dropping the \(\text{RPN}\) well below typical automotive audit escalation thresholds (\(\text{RPN} \lt 100\)).
Problem 4: Defects Per Million Opportunities (DPMO) & Sigma Level
Problem Statement: A semiconductor packaging facility produces \(12{,}000\,\text{microchips}\) during a shift. Optical testing detects \(18\,\text{defective chips}\). Each microchip has \(O = 5\) critical defect opportunity features (wire bond integrity, die attach voiding, solder ball coplanarity, mold flash, marking legibility). Calculate Defects Per Unit (\(\text{DPU}\)) and Defects Per Million Opportunities (\(\text{DPMO}\)).
Step 1: Defects Per Unit (\(\text{DPU}\)) Evaluation
$$\text{DPU} = \frac{D_{\text{total}}}{U_{\text{total}}} = \frac{18}{12{,}000} = \mathbf{0.0015\,\text{defects/unit}}$$
Step 2: Total Defect Opportunities Calculation
$$\text{Total Opportunities} = U_{\text{total}} \times O = 12{,}000 \times 5 = 60{,}000$$
Step 3: Defects Per Million Opportunities (\(\text{DPMO}\)) Resolution
$$\text{DPMO} = \left( \frac{D_{\text{total}}}{\text{Total Opportunities}} \right) \times 10^6 = \left( \frac{18}{60{,}000} \right) \times 1{,}000{,}000 = 0.0003 \times 10^6 = \mathbf{300\,\text{DPMO}}$$
Engineering Interpretation: A performance level of \(300\,\text{DPMO}\) corresponds to a quality level of approximately \(4.95\sigma\text{--}5.0\sigma\) (with standard \(1.5\sigma\) shift), representing near-benchmark yield in advanced semiconductor packaging.
Problem 5: Rolled First Pass Yield (RTY) Multi-Stage Evaluation
Problem Statement: Compute the Rolled First Pass Yield (\(\text{RTY}\)) for a 4-step consumer electronics assembly line with measured first-pass step yields: SMT Pick & Place (\(Y_1 = 0.980\)), Reflow Soldering (\(Y_2 = 0.950\)), Selective In-Circuit Test (\(Y_3 = 0.970\)), and Final Ultrasonic Enclosure Welding (\(Y_4 = 0.990\)).
Step 1: Multiplicative First-Pass Probability Formulation
$$\text{RTY} = \prod_{i=1}^4 Y_i = Y_1 \times Y_2 \times Y_3 \times Y_4$$
Step 2: Numerical Resolution
$$\text{RTY} = 0.980 \times 0.950 \times 0.970 \times 0.990$$
$$\text{RTY} = (0.93100) \times (0.96030) \approx \mathbf{0.89404} \quad (\mathbf{89.40\%})$$
Engineering Interpretation: Despite each stage exhibiting yields \(\ge 95\%\), cumulative yield loss across the 4 steps is \(10.60\%\). More than \(1\) in \(10\) completed assemblies requires offline disassembly or rework, highlighting reflow soldering (\(Y_2 = 0.950\)) as the priority candidate for thermal profile tuning.
Problem 6: Process Capability Ratio (Cp) on Vision Metrology Systems
Problem Statement: An inline vision metrology cell inspects \(5{,}000\,\text{parts/shift}\). The measured process standard deviation is \(\sigma = 0.008\,\text{mm}\). Customer tolerance limits dictate total specification width \(\text{USL} - \text{LSL} = 0.048\,\text{mm}\). Calculate the potential process capability index \(C_p\).
Step 1: Process Spread Calculation
$$6\sigma = 6 \times 0.008\,\text{mm} = 0.048\,\text{mm}$$
Step 2: Potential Capability Ratio
$$C_p = \frac{\text{USL} - \text{LSL}}{6\sigma} = \frac{0.048\,\text{mm}}{0.048\,\text{mm}} = \mathbf{1.00}$$
Engineering Interpretation: A \(C_p = 1.00\) indicates that the natural \(6\sigma\) process spread exactly equals the specification width with zero safety buffer. Any minor process mean drift (\(\mu\)) will immediately generate out-of-spec defects (\(C_{pk} \lt 1.00\)). Process variance must be compressed to achieve \(C_p \ge 1.33\).
Problem 7: Cost of Poor Quality (COPQ) Economic Accounting
Problem Statement: An industrial pump manufacturer conducts an annual Cost of Quality audit. Audited figures: Internal Failure Costs (scrap, rework, re-test) = \(\$180{,}000\); External Failure Costs (warranty claims, field returns, recall liability) = \(\$240{,}000\); Appraisal Costs (inspector wages, CMM calibration, NDT consumables) = \(\$90{,}000\); Prevention Costs (design FMEA workshops, supplier QA audits, training) = \(\$50{,}000\). Compute total annual Cost of Poor Quality (\(\text{COPQ}\)).
Step 1: COPQ Formulation (Failure and Appraisal Losses)
$$\text{COPQ} = \text{Internal Failures} + \text{External Failures} + \text{Appraisal Costs}$$
Step 2: Numerical Summation
$$\text{COPQ} = \$180{,}000 + \$240{,}000 + \$90{,}000 = \mathbf{\$510{,}000.00/\text{year}}$$
Engineering Interpretation: The firm incurs \(\$510{,}000\) in poor quality costs annually. Prevention expenditures (\(\$50{,}000\)) represent an active investment to drive down COPQ. Increasing prevention spending by \(\$30{,}000\) (e.g., poka-yoke tooling) typically yields a \(3\times\text{--}5\times\) reduction in external warranty and scrap losses.