
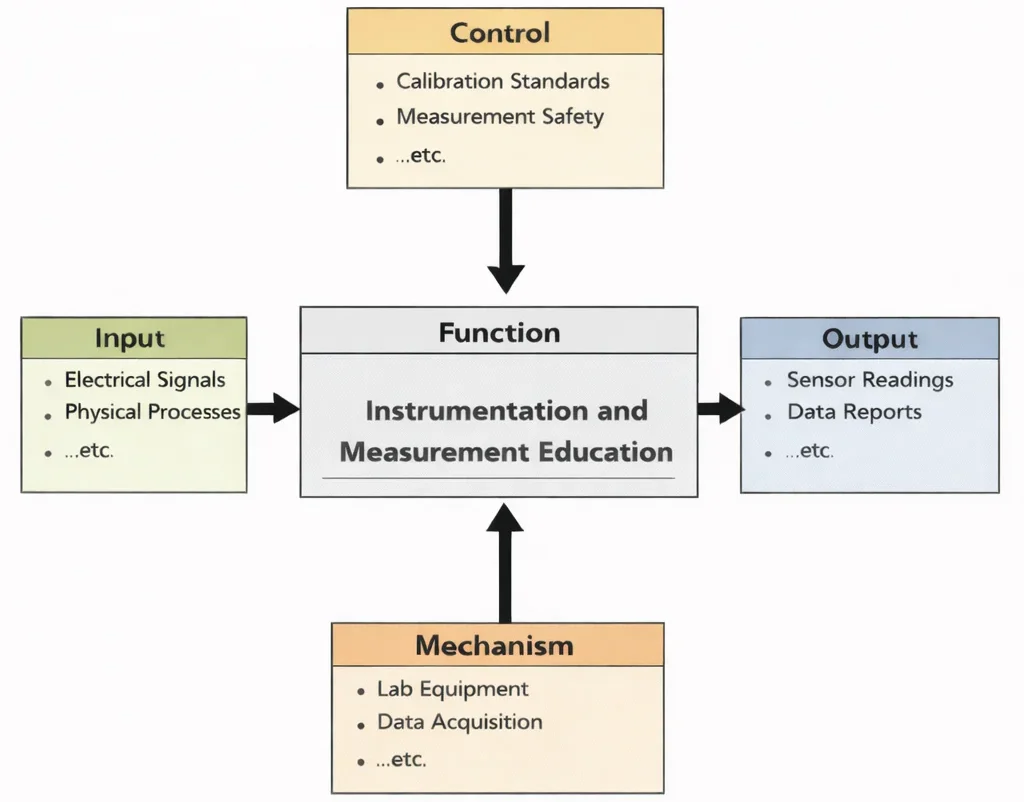
Instrumentation and Measurement Education is, at its heart, training the habit of trusting numbers only after earning that trust. The diagram shows the discipline as a pipeline: students begin with real signals and real measurement questions as Input, then learn to operate under the quiet “rules of truth” such as calibration, traceability, and safe practice as Control. With instruments, sensors, probes, and data-acquisition systems as their working hands, or Mechanism, they practise turning messy reality into clean information. The outcome is not just graphs and reports as Output, but the ability to decide whether a reading is meaningful, what uncertainty it carries, and how to test a system so conclusions can stand up in engineering practice.
Instrumentation and Measurement serve as the foundational pillars for all scientific and engineering disciplines, providing the tools and techniques needed to observe, quantify, and analyze physical phenomena. In the context of Electrical and Electronic Engineering, these systems ensure accuracy, precision, and control in complex electronic environments. From measuring voltage in circuits to capturing biosignals in Biomedical Electronics, instrumentation technologies are essential to innovation and operational safety.
Accurate sensing and data acquisition are critical in Control Systems Engineering, where feedback loops depend on precise measurements. Similarly, the performance of advanced Communication Engineering systems hinges on real-time signal diagnostics and calibration tools. Understanding how signals behave also involves techniques studied in Signal Processing.
Measurement systems are integrated directly into Electronics Engineering devices and are embedded within microcontrollers in Embedded Systems and Microelectronics. As part of intelligent networks, they are also core components of the Internet of Things (IoT) and Smart Technologies, enabling devices to sense their environments and respond autonomously.
Instrumentation is equally vital in sustainable technologies, supporting system diagnostics in Renewable Energy and Energy Storage and performance evaluation in Power Systems Engineering. In emerging domains like Quantum Electronics, measurement sensitivity approaches quantum limits, making advanced instrumentation a research frontier.
As automation advances, Robotics and Automation in E&E rely on a fusion of sensors, actuators, and feedback mechanisms—each dependent on robust instrumentation. These applications extend into Environmental Engineering, where monitoring instruments play a crucial role in pollution control and regulatory compliance.
Specific environmental applications include monitoring air quality through Air Quality Engineering sensors and analyzing water systems in Water Resources Engineering. Broader data integration is supported by Environmental Monitoring and Data Analysis, linking instrumentation to policy outcomes in Environmental Policy and Management.
Instrumentation engineers also contribute to the development of Green Building and Sustainable Design by deploying smart sensors for lighting, occupancy, and energy control. In fields like Renewable Energy Systems Engineering and Industrial Ecology and Circular Economy, instrumentation ensures system optimization and accountability in sustainable development.
From factory automation in Industrial and Manufacturing Technologies to field devices in Waste Management Engineering, instrumentation spans diverse industries. Its importance also reaches into climate-oriented efforts, such as Climate Change Mitigation and Adaptation and ecosystem stewardship via Ecological Engineering.
Students entering this field develop skills that combine theory, practical design, and system-level thinking. Whether in healthcare, energy, manufacturing, or environmental protection, instrumentation and measurement form the backbone of reliable, efficient, and safe engineering systems in the modern world.
Interactive Sensor Calibration & ADC Measurement Simulator
Simulate physical sensor signals, adjust amplification gain, introduced noise, and ADC bit resolution to observe digitization, quantization step size, and calibration offset errors in real time.

This image depicts a futuristic measurement laboratory where data quality is the central theme. In the foreground, an engineer carefully adjusts or probes a device on a glowing test surface, suggesting calibration and precise signal checking. Around the room, robotic arms and benchtop instruments represent automated testing, repeatable experiments, and controlled measurement setups. Large translucent dashboards show waveforms, dials, and trend charts, emphasizing how sensors and instruments convert real-world quantities such as temperature, pressure, strain, voltage, flow, and vibration into readable signals. Overall, the scene communicates the heart of instrumentation and measurement: accuracy, repeatability, calibration, and interpreting data correctly so decisions in engineering and science can be trusted.
Precision Measurement: Sensing, Calibration, and Data Integrity
Electrical & Electronic Engineering – Overview
Frames measurement as a foundational layer supporting monitoring, control, and quantitative systemic analysis across physical domains.
Instrumentation & Measurement (Current Page)
Designs precision sensors, transducers, and data-acquisition architectures to capture accurate physical data for analysis and control.
Signal Processing
Applies mathematical algorithms and digital filters to raw measured signals to extract meaningful physical insights.
Control Systems Engineering
Uses continuous measurement feedback loops to regulate closed-loop system behaviour and preserve dynamic stability.
Electronics Engineering
Develops low-noise analog amplifier stages and signal conditioning hardware essential for transducer front-ends.
Embedded Systems & Microelectronics
Implements real-time microcontroller-driven data acquisition and onboard firmware processing within measurement instruments.
IoT & Smart Technologies
Extends discrete measurement instruments into distributed, wireless, cloud-connected sensor networks.
Communication Engineering
Transmits raw and processed measurement telemetry securely across industrial fieldbuses and long-range networks.
Power Systems Engineering
Deploys high-voltage instrument transformers and synchrophasors for real-time electrical grid health monitoring.
Renewable Energy & Energy Storage
Measures voltage, current, and state-of-charge parameters to optimize battery storage and solar inverter efficiency.
Robotics & Automation in EE
Provides continuous tactile, optical, and positional sensing inputs that enable precise robotic feedback interaction.
Quantum Electronics
Advances atomic and optical measurement technologies to push sensing sensitivity to fundamental quantum limits.
Biomedical Electronics
Measures microvolt biopotential signals (ECG, EEG) and physiological metrics for clinical diagnostics and health monitoring.
Key Concepts in Instrumentation and Measurement
Instrumentation
Instrumentation is the multifaceted discipline dedicated to creating and deploying devices that can accurately measure, monitor, and control a wide array of physical and environmental parameters. Its applications span across scientific research, industrial automation, environmental monitoring, healthcare diagnostics, and aerospace engineering. Core components include:
- Sensors and Transducers: Fundamental to instrumentation, sensors are devices that detect physical or chemical changes—like temperature, pressure, humidity, flow, acceleration, and pH—and convert them into electrical signals. Transducers further process these signals, transforming them from one form of energy to another. High-quality instrumentation leverages advanced sensors such as strain gauge pressure sensors, NTC/PTC thermistors, MEMS accelerometers, optical fiber sensors, and piezoelectric elements. Calibration and stability under varying conditions are critical for reliable performance in industrial-grade applications.
- Signal Conditioning Circuits: Raw sensor outputs often need modification before digitization or use in control systems. Signal conditioning includes amplification (using op-amps or instrumentation amplifiers), filtering (low-pass, high-pass, band-pass, notch filters), isolation, and linearization. Modern systems integrate programmable gain amplifiers (PGAs) and digitally controlled filters to adjust to varying signal levels and noise characteristics, ensuring that the subsequent data acquisition stage receives signals within its optimal dynamic range.
- Data Acquisition Systems (DAQ): DAQ systems capture signal data—analog or digital—via analog-to-digital converters (ADCs), sampling at specified rates, and storing it in buffers or non-volatile memory for analysis. Complex DAQ setups include multiple synchronized channels, trigger mechanisms, real-time clocks, and interfaces like USB, Ethernet, or wireless connectivity. They may incorporate onboard microcontrollers or FPGA-based processing to enable edge analytics, data compression, and real-time visualization, turning raw signals into actionable intelligence.
Measurement
Measurement refers to the fundamental process of assigning numerical values to physical quantities with respect to defined units. This requires a rigorous approach to quantify how much of a parameter is present, how accurately it reflects reality, and how reliably it can be repeated. Essential attributes include:
- Accuracy: Accuracy indicates how closely a measured value matches the true or accepted standard. It is influenced by calibration, systematic errors, sensor non-linearity, and environmental factors. Highly accurate instrumentation often uses national metrology standards, traceable calibration services, and regular verification to maintain conformity over time.
- Precision: Precision measures the consistency of repeated readings under unchanged conditions. High precision means results are tightly clustered, even if they are consistently offset. Precision relies on minimal noise, stable power supplies, thermal shielding, and consistent signal conditioning to reduce random errors and ensure repeatability in scientific or industrial experiments.
- Range and Sensitivity: A sensor’s range is the interval between its minimum and maximum measurable values, while sensitivity reflects how small a change it can detect. For instance, a microvolt-level sensitivity is critical for biomedical ECG electrodes, while wide-range temperature measurements might require thermocouples capable of spanning from –200 °C to +1,200 °C. Trade-offs between range, sensitivity, and resolution must be carefully balanced to match application requirements.
Components of Instrumentation Systems
Sensors and Transducers
Sensors and transducers are at the heart of any instrumentation system, serving as the front-line components that interface with the physical world. They are responsible for detecting environmental or system variables and converting them into readable electrical signals. The diversity of sensors available today supports applications across fields as varied as biomedical engineering, aerospace, manufacturing automation, and environmental monitoring. These devices must be carefully selected to suit operational ranges, accuracy requirements, and environmental tolerances.- Temperature Sensors: These include thermocouples—which generate voltage in response to temperature differences, resistance temperature detectors (RTDs)—which operate by changing electrical resistance with temperature, and thermistors—whose resistance decreases significantly with temperature. Each type has distinct advantages and trade-offs, such as cost, sensitivity, and temperature range. Thermocouples are often used in high-temperature environments like furnaces, while RTDs are preferred for precision measurements in laboratory or industrial settings.
- Pressure Sensors: Pressure measurements are critical in hydraulic systems, weather instrumentation, and biomedical devices like blood pressure monitors. Strain gauges operate on the principle of resistance change under mechanical deformation, while piezoelectric sensors generate charge in response to stress, making them ideal for dynamic pressure changes. Capacitive sensors detect variations in pressure by measuring changes in capacitance, often used in applications requiring high sensitivity and durability.
- Flow Sensors: These are essential in fluid dynamics, chemical processing, and utility management. Ultrasonic flow meters use sound waves to measure flow rate without coming into contact with the fluid, ideal for clean or hazardous liquids. Electromagnetic flow meters work on Faraday’s Law and are suitable for conductive fluids, while turbine flow meters use mechanical rotation to determine flow velocity, making them simple and cost-effective.
- Position Sensors: Used in robotics, automotive controls, and industrial automation, these include potentiometers for linear or angular displacement, encoders for precision rotary measurement, and Hall effect sensors for detecting proximity or rotational position in magnetic fields. Modern robotics and CNC machinery heavily rely on encoders for accurate position feedback and closed-loop control.
Signal Conditioning
Signal conditioning refers to the set of techniques and hardware used to manipulate a sensor's output into a form suitable for processing. Since raw signals can be noisy, weak, or incompatible with downstream systems, signal conditioning ensures fidelity, safety, and accuracy. Without it, even the most accurate sensor can provide misleading or unreadable data. These circuits often appear as intermediary modules or integrated parts of data acquisition systems and are tailored to specific measurement needs.- Amplification to boost weak sensor signals: Signal amplification involves using operational amplifiers or instrumentation amplifiers to increase the signal strength to a usable level without distorting its content. For example, strain gauge sensors may produce millivolt-level signals that require amplification to volts for digitization.
- Filtering to remove noise or unwanted frequencies: Filters may be analog (like RC, LC, or active filters) or digital, removing high-frequency electrical noise, power line interference, or irrelevant frequency bands. Low-pass filters are often used in biomedical signals like ECG to eliminate motion artifacts and electromagnetic interference.
- Analog-to-Digital Conversion (ADC) to digitize signals for computer processing: ADCs convert continuous analog signals into discrete digital numbers using techniques such as successive approximation or sigma-delta modulation. Resolution (in bits) and sampling rate are key parameters in ADC selection.
Data Acquisition Systems
Data Acquisition Systems (DAQ) encompass both hardware and software used to collect, digitize, and store measurement data. They are crucial for transforming analog input from sensors into usable digital formats and are employed in research labs, industrial plants, environmental monitoring stations, and automotive testing facilities. High-end DAQs may support hundreds of input channels, high sampling speeds, and real-time processing with edge analytics capabilities.- Devices and software for collecting and storing data, such as LabVIEW or MATLAB: LabVIEW provides a visual programming environment ideal for prototyping, while MATLAB offers extensive toolkits for signal analysis and machine learning integration. These tools also support real-time data streaming, model-based design, and system identification.
- Interfaces like USB, Ethernet, or wireless communication: Connectivity options define how DAQs communicate with host systems, remote servers, or cloud environments. USB and Ethernet are common in benchtop DAQs, while wireless interfaces (e.g., Wi-Fi, Zigbee) allow mobility and scalability in distributed sensor networks.
Output Devices
Output devices translate collected data into a human-readable or machine-interpretable format. They are vital for visualization, diagnostics, and automated control in closed-loop systems. These outputs may appear on simple analog dials or sophisticated touchscreen HMIs (Human-Machine Interfaces) with graphical data overlays. For automated systems, outputs also include control signals that activate actuators or other subsystems based on measurement data.- Displays: Analog meters, digital readouts, and graphical screens: Analog meters are still useful in legacy systems or where visual trends matter, while digital displays provide accuracy and integration with software dashboards. OLED and LCD graphical interfaces are common in handheld devices and industrial controllers.
- Controllers: Systems that use measurement data for feedback control, such as Programmable Logic Controllers (PLCs): PLCs are central in manufacturing automation, reading sensor input, processing logic in real-time, and adjusting actuators. Advanced PLCs integrate SCADA capabilities, cloud connectivity, and remote diagnostics for robust industrial control systems.
Contemporary Computational Paradigms in Modern Instrumentation
Modern measurement systems operate far beyond simple static calibrations. Complex multi-sensor arrays, dynamic structural deformations, and quantum-limited sensing require modern computational frameworks:
- Physics-Informed Neural Networks (PINNs) for Sensor Inverse Problems: In soft robotic tactile arrays and electrical impedance tomography (EIT), PINNs solve the generalized Laplace-Poisson conductivity boundary value problem directly: $$\mathcal{L}_{\text{total}} = \mathcal{L}_{\text{voltages}} + \lambda_{\text{phys}} \left\| \nabla \cdot (\sigma(\mathbf{x}) \nabla u(\mathbf{x})) \right\|^2$$ where \(\sigma(\mathbf{x})\) is internal spatial conductivity and \(u(\mathbf{x})\) is electrostatic potential. By embedding Maxwell's governing continuity laws into the loss function, PINNs solve ill-posed spatial inverse reconstruction problems in real time without unstable finite-element matrix inversions.
- Fourier Neural Operators (FNOs) for Dynamic Calibration & Thermal Drift Compensation: High-precision transducers in aerospace turbine engines experience severe thermal transients. FNOs learn infinite-dimensional continuous operator mappings from temperature profile histories \(T(t)\) to nonlinear sensor strain offset corrections \(\Delta \epsilon(t)\), eliminating calibration drift across extreme temperature swings.
- Invariant Extended Kalman Filters (IEKF) for Multi-Sensor Fusion: In GPS-denied environments and dynamic industrial robotics, IEKF operates directly on the Lie group \(SE_2(3)\) to fuse triaxial accelerometers, gyroscopes, magnetometers, and optical encoders. By exploiting group affine symmetries, the filter maintains deterministic covariance error bounds and completely avoids Euler angle singularities.
- Telemetry-Synchronized Digital Twins & Predictive Metrology: Industrial test benches synchronize physical DAQ telemetry with digital twins running real-time Fault Detection, Isolation, and Recovery (FDIR). By continuously computing sensor residuals against physical models, the system flags thermocouple degradation or strain gauge debonding before measurement errors compromise industrial safety.
Applications of Instrumentation and Measurement
Industrial Automation
Instrumentation is a cornerstone of automated manufacturing and process control. In industrial settings such as chemical processing plants, food production lines, and refineries, instrumentation enables continuous monitoring of operational variables that are crucial to maintaining efficiency, safety, and product quality.
- Monitoring: Measuring temperature, pressure, flow, and level in industrial processes is critical for optimizing operations and avoiding system failures. Sensors gather real-time data which is displayed on supervisory systems or HMIs (Human-Machine Interfaces), helping operators make quick decisions.
- Control Systems: Using data from sensors to regulate machinery and processes ensures consistency and repeatability. Closed-loop systems automatically adjust input variables in response to deviations, reducing human intervention and increasing precision.
- Robotics: Enabling precision and adaptability through position and force sensors allows robots to perform complex, repetitive tasks such as welding, assembly, and material handling with high accuracy. Advanced feedback loops help robots adapt to variations in their environments.
Medical Diagnostics
Instrumentation has transformed healthcare by enabling accurate diagnosis, continuous monitoring, and personalized treatment plans. From high-end imaging systems in hospitals to wearable monitors at home, instrumentation plays a vital role in patient care and medical research.
- Diagnostic Equipment: MRI machines, X-ray systems, and blood glucose monitors rely on highly calibrated sensors to detect minute biological changes. These devices convert physical parameters into electronic data for doctors to interpret, often with the aid of artificial intelligence algorithms.
- Patient Monitoring: Devices measuring heart rate, blood pressure, oxygen saturation, and EEG/ECG provide real-time data for clinical decisions. Such instruments are used in ICUs, during surgery, and in home-care setups to alert caregivers to critical changes in patient status.
- Wearable Health Devices: Fitness trackers and implantable monitors for continuous data collection are widely used in preventive care and chronic disease management. They offer insights into activity levels, sleep patterns, and overall health trends.
Environmental Monitoring
Instrumentation ensures compliance with environmental regulations and promotes sustainability through continuous measurement of air, water, and soil quality.
- Air Quality Monitors: Measuring pollutants like CO2, NOx, and particulate matter helps identify emission sources and assess health risks in urban and industrial zones. These instruments play a role in climate research and public health policy.
- Water Quality Sensors: Monitoring parameters like pH, turbidity, and dissolved oxygen is essential in water treatment plants, aquaculture, and environmental impact assessments. Portable sensors are also used in field surveys and disaster response.
- Climate Monitoring: Sensors for tracking temperature, humidity, and wind speed in meteorology feed data into forecasting models. They are deployed in weather stations, satellites, and ocean buoys to provide accurate, long-term environmental data.
Aerospace and Defense
Advanced instrumentation is critical in aerospace systems and military applications, where reliability, precision, and robustness under extreme conditions are non-negotiable.
- Avionics: Instruments for altitude, speed, and orientation in aircraft are vital for navigation and safety. Redundant sensor systems ensure continuous operation even in the event of component failures.
- Space Exploration: Sensors for analyzing atmospheric conditions, radiation, and planetary surfaces must operate reliably under vacuum, extreme temperatures, and high-radiation environments. These instruments enable scientific discoveries and mission-critical decisions.
- Weapon Systems: Target tracking and guidance systems depend on radar, infrared, and laser-based instrumentation. Real-time measurement enables precision strikes and adaptive response to threats in dynamic combat environments.
Energy and Power Systems
Instrumentation improves efficiency and safety in power generation and distribution, and plays a growing role in integrating renewable energy sources into the grid.
- Smart Grids: Monitoring voltage, current, and frequency in real-time allows utilities to respond dynamically to demand changes and prevent outages. Smart meters enable consumers to track their usage and adjust consumption habits.
- Renewable Energy: Sensors for optimizing solar panel angles and wind turbine operations increase energy yield. In solar farms and wind parks, automated tracking and adjustment systems rely on accurate instrumentation for optimal performance.
- Energy Audits: Measuring energy consumption and identifying inefficiencies supports sustainability initiatives in buildings, factories, and campuses. Portable meters and IoT-connected sensors allow for comprehensive energy profiling.
Research and Development
Accurate measurement is essential in scientific and engineering research, where new theories are validated through experimental data.
- Material Testing: Measuring mechanical properties like stress, strain, and hardness supports the development of new materials for construction, aerospace, and medical implants. These measurements must meet rigorous standards of repeatability and accuracy.
- Chemical Analysis: Instruments like spectrometers and chromatographs detect chemical compositions at micro or nano scales, supporting research in pharmaceuticals, food safety, and nanotechnology.
- Experimental Physics: High-precision tools for studying subatomic particles are at the core of discoveries in quantum mechanics and particle physics. These tools must operate in ultra-clean environments with extremely low tolerances for error.
Tools and Techniques in Instrumentation and Measurement
Measurement Devices
- Multimeters: Modern digital multimeters are essential for troubleshooting electrical systems, offering functions like auto-ranging, true RMS readings, and data logging. These instruments are widely used across electrical, electronic, and industrial fields to ensure operational integrity of circuits and devices.
- Oscilloscopes: Oscilloscopes display voltage signals over time, making them invaluable in evaluating signal quality, identifying noise, and troubleshooting faults in analog and digital circuits. They range from basic two-channel models to advanced mixed-signal oscilloscopes with integrated logic analyzers.
- Spectrum Analyzers: These tools break down complex signals into their component frequencies, helping engineers study bandwidth usage, identify interference sources, and validate RF communication performance. They are vital in fields like telecommunications, radio astronomy, and EMI/EMC testing.
In addition to handheld instruments, bench-top precision instruments are used in laboratories for high-accuracy tasks, often featuring advanced connectivity options for remote operation and automation. Specialized devices like impedance analyzers, signal generators, and LCR meters further expand the scope of measurement.
Calibration
Calibration involves comparing the readings of an instrument to a known reference or standard to verify accuracy. It's an essential quality assurance process in sectors like aerospace, healthcare, and manufacturing. Calibration labs use traceable standards that conform to international measurement systems, ensuring consistency across facilities and jurisdictions.
Organizations such as NIST (National Institute of Standards and Technology) provide the global benchmark for calibration standards. Regular calibration helps prevent measurement drift over time, ensures compliance with regulations, and extends equipment life through proactive maintenance.
Wireless Instrumentation
- IoT Integration: The emergence of the Internet of Things (IoT) has revolutionized instrumentation by enabling smart sensors that communicate wirelessly via Wi-Fi, Bluetooth, Zigbee, or low-power networks like LoRaWAN.
- Remote Monitoring: In hazardous or inaccessible locations such as oil rigs or high-voltage substations, wireless instrumentation allows for safe, real-time monitoring of process variables.
Data Analysis Tools
- Software like MATLAB, Python, and R are integral in processing, visualizing, and interpreting data obtained from measurement instruments.
- Machine learning algorithms are increasingly being employed for predictive maintenance, anomaly detection, and automated baseline compensation.
Challenges in Instrumentation and Measurement
- Accuracy, Metrological Traceability, and Long-Term Sensor DriftInstrumentation must achieve a delicate balance between high accuracy and cost-effectiveness. Over time, physical sensor elements experience drift caused by material oxidation, semiconductor aging, and thermal fatigue: $$V_{\text{error}}(t) = V_{\text{drift}} \cdot \ln\left(1 + \frac{t}{\tau}\right) + \alpha \Delta T$$ Addressing long-term drift requires rigorous metrological chains traceable to the International System of Units (SI) via primary standards maintained by NIST or BIPM. In remote installations, embedded auto-zeroing and ratiometric bridge topographies are required to distinguish physical parameter shifts from sensor degradation.
- Electromagnetic Noise, Common-Mode Voltage, and Ground LoopsHigh-sensitivity instruments measuring microvolt-level signals—such as thermocouples or strain gauges—operate in environments contaminated by 50/60 Hz powerline hum, switched-mode power supply (SMPS) EMI, and radio-frequency interference (RFI). When sensor grounds and DAQ chassis grounds reside at different electrical potentials, stray currents circulate through shield grounds, creating ground loop error voltages. Mitigating this demands three-op-amp instrumentation amplifiers with Common-Mode Rejection Ratios exceeding \(100\,\text{dB}\), galvanic optoelectronic isolation, and star-grounded differential wiring.
- High-Channel Scalability, Clock Jitter, and SynchronizationAs industrial and structural health monitoring networks scale to thousands of channels, preserving temporal synchronization becomes challenging. Clock skew and phase jitter across distributed ADC sampling clocks corrupt cross-channel correlation and modal vibration analysis. Engineers deploy IEEE 1588 Precision Time Protocol (PTP) over Ethernet or optical timing buses to enforce sub-microsecond hardware timestamping across all DAQ modules.
- Extreme Harsh Environments and Material LimitsDeploying sensors in geothermal wells, downhole drilling, jet engine combustors, or chemical reactors exposes transducers to extreme temperatures (\(\gt 400^\circ\text{C}\)), pressures (\(\gt 100\,\text{MPa}\)), and corrosive acids. Standard silicon semiconductors fail above \(150^\circ\text{C}\) due to intrinsic thermal carrier generation. Designers must deploy Silicon Carbide (SiC) piezoresistive elements, platinum RTDs, and sapphire-sheathed fiber Bragg grating (FBG) optical sensors that operate without onboard electronics in the hot zone.
- Edge-to-Cloud Integration, Cyber-Physical Security, and InteroperabilityIntegrating legacy field instruments with cloud analytics platforms introduces protocol fragmentation and cybersecurity vulnerabilities. Unencrypted sensor data streams are vulnerable to man-in-the-middle spoofing and false data injection. Modern instrumentation requires edge gateways running OPC Unified Architecture (OPC UA) with hardware-encrypted TLS channels.
Future Trends in Instrumentation and Measurement
- Smart Sensors and Self-Calibrating Edge MetrologyFuture instrumentation will integrate sensing, programmable analog front-ends, and edge machine learning directly onto MEMS silicon. Embedded firmware uses internal physical references (e.g., bandgap voltage standards, capacitive self-test electrostatic actuators) to detect sensor drift and execute autonomous recalibration without human intervention.
- Miniaturization and Lab-on-a-Chip TransducersAdvances in microfluidics and MEMS allow full laboratory analytical workflows—such as gas chromatography and electrochemical blood biomarker panels—to fit on a sub-centimeter silicon chip, enabling portable field diagnostics.
- Autonomous Energy Harvesting & Zero-Power SensorsUltra-low-power sensing front-ends operating at sub-microwatt levels draw power from ambient mechanical vibration (piezoelectric), thermal gradients (thermoelectric), or ambient RF fields, eliminating battery maintenance in inaccessible structural monitoring applications.
- AI-Driven Metrology and Automated Anomaly DetectionMachine learning models embedded directly in DAQ instruments distinguish physical system anomalies from sensor degradation. By processing high-frequency spectral vibration data in real time, edge algorithms flag bearing micro-cracks weeks before mechanical seizure.
- Quantum-Enhanced Sensing and StandardsQuantum measurement leverages atomic superposition and entangled photon states to achieve sensitivities limited only by Heisenberg's uncertainty principle. Nitrogen-vacancy (NV) diamond magnetometers detect single-electron spins, while optical atomic clocks redefine the SI second and enable GPS-independent inertial navigation.
- Ubiquitous Industrial IoT (IIoT) Mesh ArchitecturesThousands of intelligent sensor nodes communicate over deterministic wireless mesh protocols (WirelessHART, ISA100.11a), delivering synchronized multi-point process telemetry directly to plant digital twin architectures.
Worked Numerical Application: Precision Wheatstone Bridge & Instrumentation Amplifier Sizing
Engineering Calculation: Quarter-Bridge Strain Gauge Conditioning & ADC Dynamic Range Matching
Problem Formulation: An industrial load cell utilizes a quarter-bridge Wheatstone strain gauge with nominal unstrained resistance \(R = 350.0\,\Omega\) and gauge factor \(GF = 2.10\). The bridge is energized by an excitation voltage \(V_{\text{EXC}} = 10.0\,\text{V}\). The sensor is subjected to a maximum structural tensile strain \(\epsilon_{\max} = 800\,\mu\epsilon\) (\(800 \times 10^{-6}\)). The differential output voltage \(\Delta V_{\text{out}}\) is conditioned using a three-op-amp instrumentation amplifier with internal feedback resistors \(R_1 = 49.4\,\text{k}\Omega\) and an external gain resistor \(R_g\). The amplified signal must match the \(0\text{--}5.0\,\text{V}\) full-scale input of a 16-bit successive approximation ADC (\(V_{\text{ref}} = 5.0\,\text{V}\)).
Analytical Derivation & Step-by-Step Calculations:
Step 1: Calculate the Maximum Bridge Unbalance Differential Output Voltage (\(\Delta V_{\text{bridge}}\)):
For a quarter-bridge configuration under small strains (\(\frac{\Delta R}{R} \ll 1\)):
$$\frac{\Delta R}{R} = GF \times \epsilon_{\max} = 2.10 \times (800 \times 10^{-6}) = 1.68 \times 10^{-3}$$ $$\Delta V_{\text{bridge}} = \frac{V_{\text{EXC}}}{4} \left( \frac{\Delta R}{R} \right) = \frac{10.0\,\text{V}}{4} \times (1.68 \times 10^{-3}) = 2.50 \times (1.68 \times 10^{-3}) = \mathbf{4.20 \times 10^{-3}\,\text{V}}\quad (4.20\,\text{mV})$$Step 2: Determine Required Instrumentation Amplifier Gain (\(A_v\)):
To map the peak strain output of \(4.20\,\text{mV}\) to the full-scale ADC input \(V_{\text{ADC,max}} = 5.0\,\text{V}\):
$$A_v = \frac{V_{\text{ADC,max}}}{\Delta V_{\text{bridge}}} = \frac{5.0\,\text{V}}{0.00420\,\text{V}} \approx \mathbf{1190.48}$$Step 3: Size the External Gain Resistor (\(R_g\)):
The transfer function for a standard three-op-amp instrumentation amplifier is:
$$A_v = 1 + \frac{2 R_1}{R_g} \quad \Rightarrow \quad \frac{2 R_1}{R_g} = A_v - 1 \quad \Rightarrow \quad R_g = \frac{2 R_1}{A_v - 1}$$ $$R_g = \frac{2 \times (49.4 \times 10^3\,\Omega)}{1190.48 - 1} = \frac{98\,800\,\Omega}{1189.48} \approx \mathbf{83.06\,\Omega}$$Using standard precision metal-film resistors (\(\pm 0.1\%\) tolerance), an engineer selects \(R_g = 83.5\,\Omega\) or uses a calibrated trimmer network to achieve exact full-scale calibration.
Step 4: Compute ADC Quantization Resolution and Minimum Resolvable Strain (\(\Delta \epsilon_{\text{LSB}}\)):
For a 16-bit ADC over a \(5.0\,\text{V}\) reference span:
$$V_{\text{LSB}} = \frac{V_{\text{ref}}}{2^{16}} = \frac{5.0\,\text{V}}{65\,536} \approx 7.6294 \times 10^{-5}\,\text{V} = \mathbf{76.29\,\mu\text{V}}$$Referred to the physical strain input:
$$\Delta \epsilon_{\text{LSB}} = \frac{\epsilon_{\max}}{2^{16}} = \frac{800\,\mu\epsilon}{65\,536} \approx \mathbf{0.0122\,\mu\epsilon/LSB}\quad (\mathbf{12.2\,\text{n}\epsilon})$$Physical & Metrological Takeaways: The quarter-bridge generates an extremely weak signal (\(4.20\,\text{mV}\) at peak strain), operating at high common-mode bias (\(V_{\text{cm}} = V_{\text{EXC}}/2 = 5.0\,\text{V}\)). Sizing the high-gain amplifier (\(A_v \approx 1190.5\)) with an external resistor \(R_g = 83.06\,\Omega\) maps the sensor signal across the entire 16-bit ADC dynamic range, providing an ultra-fine resolution of \(0.0122\,\mu\epsilon\) per count while rejecting common-mode excitation noise.
Systems Engineering Architecture: Trade-Off Analysis
Designing modern instrumentation and data acquisition hardware requires balancing resolution, measurement bandwidth, environmental robustness, and thermal noise limits. The following matrix illustrates primary engineering compromises in instrumentation design:
| Design Domain | Architectural Dilemma | Favorable Attributes (+) | Compromised Metrics (−) | System Mitigation Strategy |
|---|---|---|---|---|
| Temperature Sensing | Thermocouple vs. Platinum RTD (PT100) | Thermocouple: Extreme range (\(-200^\circ\text{C}\) to \(+1700^\circ\text{C}\)); rugged, self-powered, low unit cost. | Low Seebeck sensitivity (\(\sim 40\,\mu\text{V/}^\circ\text{C}\)); non-linear; requires cold-junction compensation (CJC). | Use RTDs for precision metrology (\(\le 600^\circ\text{C}\)); reserve thermocouples for high-temperature furnaces. |
| ADC Architecture | Successive Approximation (SAR) vs. Sigma-Delta (\(\Sigma\Delta\)) ADC | SAR: Zero latency; fast multiplexing; sampling rates up to several MSPS. | Requires complex analog anti-aliasing filters; limited to moderate resolution (\(\le 18\text{-bit}\)). | Use \(\Sigma\Delta\) (with oversampling and digital Sinc filtering) for precision DC/audio; SAR for multi-channel DAQ. |
| Strain Conditioning | Quarter-Bridge vs. Full-Bridge Strain Topology | Quarter-Bridge: Minimum wiring; single active sensor element; lowest hardware installation cost. | Severe temperature-induced drift (\(\Delta R_{\text{temp}}\)); lowest sensitivity (\(V_{\text{EXC}}/4\)); nonlinear response. | Full-bridge arrangement with paired Poisson gauges for 4x output amplification and automatic thermal cancellation. |
| Telemetry Transmission | Analog 4–20 mA Current Loop vs. Digital RS-485 / Modbus | 4–20 mA: Immune to line resistance voltage drops; simple fault detection (broken wire = \(0\,\text{mA}\)). | Univariate (one parameter per wire pair); zero remote diagnostic capability; no sensor self-calibration. | HART protocol modulating FSK digital communications directly over analog 4–20 mA current loops. |
Case Studies in Instrumentation and Measurement
Industrial Automation
General Electric’s Predix platform exemplifies the integration of advanced IoT-enabled instrumentation in the industrial sector, enabling real-time monitoring, predictive maintenance, and performance optimization across large-scale facilities. Through a network of connected sensors, Predix collects data on temperature, pressure, vibration, and equipment usage, transmitting it to centralized analytics engines that detect inefficiencies or early signs of failure. These insights help industries reduce unplanned downtime, extend the lifespan of critical machinery, and enhance energy management. In sectors such as power generation and aviation, this capability enables better asset utilization and ensures consistent operational standards, minimizing human intervention while boosting productivity. The platform's cloud-based architecture allows secure access from multiple locations, enabling global coordination of operations. Its scalable design is suitable for small manufacturers and multinational conglomerates alike, adapting dynamically to industry-specific instrumentation requirements.
Medical Diagnostics
The development of continuous glucose monitoring (CGM) systems such as Dexcom represents a transformative leap in diabetes care, combining wearable biosensors, real-time data transmission, and cloud-based analytics. Unlike traditional finger-prick methods, CGMs use minimally invasive sensors placed under the skin to monitor glucose levels every few minutes. These readings are transmitted wirelessly to smartphones or insulin pumps, enabling dynamic insulin adjustment and reducing the risk of hypo- or hyperglycemia. Moreover, many systems now employ predictive algorithms that alert users before dangerous trends occur, allowing preemptive intervention. Beyond patient benefits, healthcare providers gain long-term insights from data logs, facilitating personalized treatment plans and enhancing patient-doctor collaboration. In addition, CGMs have become integral to closed-loop insulin delivery systems, often called "artificial pancreas" devices, that automatically regulate insulin based on sensor data, offering improved glycemic control and quality of life.
Environmental Monitoring
NASA’s Earth Observing System (EOS) serves as a pioneering framework for global-scale environmental instrumentation and satellite-based data acquisition. Utilizing an array of sophisticated instruments aboard satellites like Terra, Aqua, and Aura, EOS measures key environmental parameters including atmospheric temperature, ocean salinity, vegetation density, and polar ice coverage. These data streams feed into predictive climate models and contribute to our understanding of long-term environmental trends and human impact. The system’s use of spectroradiometers, radar altimeters, and thermal infrared sensors allows for precise measurements of subtle environmental changes over time. For example, the Moderate Resolution Imaging Spectroradiometer (MODIS) aboard Terra and Aqua captures high-resolution data across 36 spectral bands, offering insights into deforestation, water vapor concentration, and urban heat islands. The EOS database is accessible to scientists and policymakers worldwide, providing essential data for climate mitigation strategies, biodiversity preservation, and disaster response planning.
Why Study Instrumentation and Measurement
Instrumentation and Measurement: Conclusion
Instrumentation and measurement form the critical infrastructure behind virtually every scientific and technological breakthrough in the modern world. They provide the means to observe, quantify, and manipulate physical phenomena with precision, enabling informed decision-making and technological innovation. In the medical field, for instance, accurate instrumentation is key to early diagnosis, real-time patient monitoring, and effective treatment planning. Devices like ECG monitors, blood analyzers, and MRI scanners depend on sophisticated measurement systems that convert physiological signals into interpretable data.
In manufacturing, the importance of measurement and control systems cannot be overstated. From ensuring the dimensional accuracy of components to maintaining optimal conditions in process industries, instrumentation enhances quality, efficiency, and safety. Robotics, CNC machines, and automated assembly lines rely heavily on sensors, actuators, and feedback loops. Similarly, in aerospace and defense, precise measurement systems underpin everything from flight control and navigation to propulsion monitoring and mission-critical telemetry.
Environmental sustainability also owes much to advancements in instrumentation. Modern climate science is rooted in data acquired through networks of sensors measuring air and water quality, greenhouse gas levels, ocean currents, and solar radiation. The application of advanced sensing technologies enables governments and researchers to monitor environmental change, enforce regulations, and respond to natural disasters with real-time insight. These tools are essential for protecting ecosystems and ensuring the long-term health of the planet.
As we move deeper into the era of smart systems, the convergence of instrumentation with Artificial Intelligence (AI), Internet of Things (IoT), and cyber-physical systems is revolutionizing how measurements are captured, interpreted, and applied. Smart sensors that self-calibrate and process data locally (edge computing) are increasingly common, reducing latency and enhancing real-time control. Furthermore, AI-powered analytics enable predictive maintenance and anomaly detection, transforming passive monitoring systems into proactive intelligence hubs.
The future of instrumentation and measurement lies in further miniaturization, integration, and adaptability. Innovations in nanomaterials and MEMS (Micro-Electro-Mechanical Systems) are enabling the development of ultra-sensitive, low-power sensors for wearable health monitors, implantable devices, and environmental microdetectors. With quantum sensing on the horizon, we may soon achieve measurement accuracies previously thought unattainable, opening new frontiers in particle physics, metrology, and navigation systems independent of GPS.
Ultimately, instrumentation and measurement are not just technical fields—they are enablers of progress across disciplines. By providing the tools to observe and understand complex systems, they empower innovation in everything from biomedical engineering to smart infrastructure. As these tools continue to evolve in tandem with emerging technologies, their role in shaping a safer, smarter, and more sustainable world will only grow more central.
Frequently Asked Questions
1. Why do engineers care about both accuracy and precision in measurements?
Accuracy tells you how close your measured value is to the true value, while precision tells you how consistent your readings are when you repeat the same measurement. A system that is only accurate once is not very useful, and one that is only precise may repeatedly give the wrong answer. Reliable instrumentation aims for both: measurements that are tightly clustered and centred on the true value.
2. What exactly does a transducer do in a measurement system?
Most physical quantities cannot be fed directly into a digital instrument. A transducer serves as the bridge, turning temperature, pressure, light, force, or motion into an electrical signal that can be amplified, filtered, digitised, and analysed. Choosing the right transducer is the first step in building a meaningful measurement chain.
3. How can I tell whether my measurement errors are systematic or random?
If your readings are consistently too high or too low across many trials, you probably have systematic error, often linked to calibration issues or a biased method. If your measurements scatter around a mean value in an unpredictable way, random error is dominant. Calibrating against standards reduces systematic error, whereas averaging and careful experimental design help reduce random error.
4. What happens during calibration, and how often should it be done?
Calibration compares the instrument’s output with the response of a trusted reference under controlled conditions. Any consistent offsets or gain errors are noted and corrected, either in the hardware or in software. The frequency of calibration depends on how critical the measurements are, how harsh the operating environment is, and how quickly components are likely to drift.
5. Why do measurement systems need signal conditioning?
Raw sensor signals are rarely ready to be digitised directly. They may be too small, buried in noise, or centred at the wrong voltage. Signal conditioning amplifies or attenuates the signal, filters out unwanted frequencies, isolates circuits for safety, and matches impedance so that the data acquisition hardware sees a clean, usable input. Good conditioning is often the difference between noisy, unreliable readings and high-quality measurements.
6. How do ADCs and DACs connect the physical world to digital electronics?
An ADC samples an analog signal at regular intervals and converts each sample into a numeric value that a microcontroller or computer can process. A DAC takes numeric values and reconstructs an analog signal, for example to drive a speaker or control a valve. Together, they let digital systems sense and act on real-world quantities with fine control and flexibility.
7. What is Nyquist frequency, and why can undersampling be dangerous?
The Nyquist frequency is half of the sampling rate. To capture all important features of a signal without distortion, the sampling rate must be at least twice the highest frequency present. If you sample too slowly, high-frequency content is misinterpreted as lower frequencies (aliasing), which can completely mislead your analysis or control decisions. Anti-aliasing filters and appropriate sampling rates are therefore essential.
8. How do engineers choose the “right” sensor for a job?
They start by matching the sensor’s measurement range and accuracy to the application’s needs, then consider response time, environmental limits, size, cost, and how easily the sensor integrates with the electronics. A good choice will operate reliably where it is installed and provide signals that can be conditioned and digitised without difficulty.
9. In what ways does temperature affect instruments and sensors?
Temperature shifts can change resistance values, alter semiconductor behaviour, and cause mechanical parts to expand or contract. These effects show up as drift in readings or changes in sensitivity. To combat this, designers use components with low temperature coefficients, add compensation circuits or algorithms, and, when necessary, stabilise the physical environment around the measurement system.
10. How are wireless and IoT technologies reshaping measurement and instrumentation?
Instead of relying on long cables and centralised hardware, modern systems can deploy many wireless sensors that report data to gateways or cloud platforms. This makes it easier to monitor remote, moving, or hard-to-access assets. At the same time, engineers must manage power budgets, choose appropriate wireless protocols, and design robust security so that the data flowing through these networks remains trustworthy.
Instrumentation and Measurement Practice Module
Core Concept Review Questions
1. Why are accuracy and precision both important in measurement, and how do they differ?
Answer: Accuracy describes how close a measurement is to the true or accepted value, while precision describes how tightly clustered repeated measurements are under the same conditions. An instrument can be precise but not accurate if all readings are consistently offset from the true value, and it can be accurate on average but imprecise if readings scatter widely. In practice, engineers aim for high accuracy and high precision so that results are both correct and repeatable, which is crucial in areas such as healthcare diagnostics, quality control, and scientific experimentation.
2. What role do transducers play in instrumentation systems, and why are they essential?
Answer: Transducers convert physical quantities—such as force, pressure, temperature, or light intensity—into electrical signals that measurement circuits can process. For example, a strain gauge converts mechanical deformation into a change in resistance, a thermocouple converts temperature differences into a voltage, and a photodiode converts light into current. Without transducers, electronic instruments would have no way to sense the physical environment. Selecting and configuring the right transducer ensures that the system captures the key variable of interest with sufficient sensitivity, stability, and robustness.
3. How do systematic and random errors differ, and what strategies can reduce their impact?
Answer: Systematic errors are consistent biases that push all measurements in the same direction, often caused by miscalibration, incorrect reference values, or flawed experimental setups. They can usually be identified by comparison with standards and corrected through calibration or improved procedures. Random errors arise from unpredictable influences like electrical noise, small environmental fluctuations, or operator variability, causing measurements to fluctuate around a mean value. Engineers reduce random errors by averaging repeated measurements, improving shielding and grounding, controlling environmental conditions, and using better instruments. Distinguishing between these error types is essential for interpreting data correctly.
4. Why is regular calibration necessary for reliable instruments, and what does a typical calibration process involve?
Answer: Over time, components drift, sensors age, and mechanical parts wear, causing instruments to deviate from their original behaviour. Calibration restores confidence in the readings by checking the instrument against known reference standards. A typical calibration sequence exposes the instrument to a series of well-defined input values, records the outputs, and compares them with expected results. Any systematic differences are documented and corrected by adjusting internal settings or applying software correction factors. Establishing a suitable calibration interval and keeping traceable records are vital in regulated industries where measurement accuracy underpins safety, compliance, and product quality.
5. What is signal conditioning, and how does it improve the quality of measurement data?
Answer: Signal conditioning encompasses all the processing applied to a raw sensor signal before it is digitised or used by other circuitry. Common functions include amplification of weak signals, attenuation of signals that are too large, filtering to remove unwanted noise or interference, level shifting to match the input range of an ADC, and electrical isolation for safety or noise reduction. Without proper conditioning, important details can be lost in noise, or the signal might saturate the acquisition system. By shaping the signal into a clean, well-scaled form, signal conditioning lays the foundation for accurate and stable measurements.
6. How do ADCs and DACs bridge the gap between analog signals and digital processing?
Answer: An analog-to-digital converter (ADC) samples a continuous-time, continuous-amplitude signal and represents each sample as a digital value with finite resolution. This allows microcontrollers, digital signal processors, and computers to store, analyse, and manipulate real-world data such as temperature trends or vibration spectra. A digital-to-analog converter (DAC) performs the opposite function, turning digital numbers into analog voltages or currents that can drive actuators, generate test signals, or reconstruct audio. Together, ADCs and DACs enable sophisticated control, monitoring, and communication systems that rely on digital computation but must interact with the analog world.
7. What is the relationship between sampling rate, Nyquist frequency, and aliasing in data acquisition?
Answer: The sampling rate is how often an analog signal is measured per second, and the Nyquist frequency is half of that rate. According to the Nyquist–Shannon sampling theorem, to represent a signal faithfully without aliasing, the sampling rate must be at least twice the highest frequency component present in the signal. If the sampling rate is too low, higher-frequency components masquerade as lower frequencies in the sampled data, creating aliasing that distorts analysis or control decisions. To prevent this, engineers select an appropriate sampling rate and use analog anti-aliasing filters to remove components above the Nyquist frequency before sampling.
8. Which criteria guide the selection of a sensor for a specific measurement task?
Answer: Sensor selection begins with matching the measurable range and required accuracy to the application’s needs. Engineers then consider sensitivity, resolution, response time, and long-term stability. Environmental factors such as temperature, humidity, vibration, and chemical exposure must also be taken into account, as well as the sensor’s physical size, mounting options, and ease of integration with electronics and software. A carefully chosen sensor will perform reliably under real operating conditions and deliver signals that can be conditioned and digitised without excessive complexity.
9. How do temperature variations influence the behaviour of measurement equipment, and how can these effects be mitigated?
Answer: Temperature changes can alter resistor values, shift semiconductor characteristics, and expand or contract mechanical elements, all of which can introduce drift, offset, or gain changes in instruments and sensors. To mitigate these effects, designers may select components with low temperature coefficients, include temperature compensation networks, or apply software correction based on simultaneous temperature measurements. In critical applications, instruments may be housed in temperature-controlled enclosures or calibrated across the expected temperature range to maintain accuracy over varying environmental conditions.
10. How are wireless technologies and the Internet of Things (IoT) transforming instrumentation and measurement?
Answer: Wireless and IoT technologies enable large populations of sensors to be deployed over wide areas, sending data to local gateways or cloud platforms without extensive cabling. This opens up new possibilities for remote monitoring, predictive maintenance, environmental sensing, and smart infrastructure. At the same time, designers must address challenges such as limited battery capacity, radio interference, secure data transmission, and network management. When these issues are handled well, wireless instrumentation and IoT architectures provide rich, real-time data streams that can significantly improve decision-making and system efficiency.
Analytical & Scenario-Based Analysis
1. How do measurement resolution and sensor dynamic range interact to influence data collection quality?
Resolution defines the smallest detectable change, whereas dynamic range spans minimum to maximum measurable limits. High resolution in a narrow range risks saturation under large transients, while broad dynamic range without adequate bit-depth reduces granularity. Engineers balance both to maintain signal fidelity without clipping.
2. In what ways can advanced signal processing enhance reliability, and when do simple methods suffice?
Kalman filtering and spectral decomposition uncover hidden signal patterns and filter transient noise in dynamic environments. However, for stable phenomena like steady-state thermal monitoring, a simple hardware RC low-pass filter eliminates complexity and computational overhead.
3. Why must engineers carefully balance sampling rate, storage capacity, and data integrity in long-term logging?
Over-sampling creates massive data volumes that strain memory, bandwidth, and processing infrastructure, while undersampling introduces aliasing and missed transient events. Dynamic event-triggered logging optimizes storage by accelerating sample rates only during state transitions.
4. How do engineers juggle sensor durability, cost, and fidelity when measuring in harsh environments?
Heavy stainless steel or ceramic enclosures protect sensors against corrosive chemicals and pressure, but introduce thermal or mechanical inertia. Engineers mitigate latency by employing differential sensing topologies and software lag compensation.
5. Why is calibration not a one-time event, and how do standards maintain confidence over time?
Component aging, thermal cycling, and mechanical stress induce baseline drift over time. Periodic calibration against NIST-traceable reference standards re-establishes mathematical alignment, maintaining legal and regulatory compliance in safety-critical applications.
6. How can measurement repeatability be ensured across environmental swings and equipment aging?
Repeatability requires isolating the sensor from external variables using hermetic shielding, temperature-compensated active circuits, constant-current bridge excitation, and ratiometric ADC conversion architectures that cancel power supply fluctuations.
7. How does real-time measurement analysis empower predictive maintenance in industrial automation?
Edge analytics process high-frequency vibration and acoustic spectra locally to detect early bearing degradation signatures. Identifying anomalous frequency peaks enables scheduled maintenance prior to catastrophic mechanical seizure.
8. How do multi-parameter measurement systems address sensor cross-sensitivity issues?
Cross-sensitivity occurs when secondary variables (e.g., temperature) alter primary readings (e.g., pressure). Multi-sensor arrays co-locate temperature sensors alongside strain bridges, utilizing software compensation matrices to cancel cross-talk dynamically.
Quantitative Engineering Calculations
1. ADC Quantization Resolution Step Size: Calculate levels \(N\) and step size \(V_{\text{LSB}}\) for a 12-bit ADC with \(V_{\text{ref}} = 4.096\,\text{V}\).
Solution:
Total quantization intervals:
$$N = 2^{12} = \mathbf{4096\,\text{levels}}$$
Voltage step size per least significant bit:
$$V_{\text{LSB}} = \frac{V_{\text{ref}}}{2^{12}} = \frac{4.096\,\text{V}}{4096} = 0.001\,\text{V} = \mathbf{1.0\,\text{mV}}$$
2. Instrumentation Amplifier Closed-Loop Gain: Calculate gain \(A_v\) and output \(V_{\text{out}}\) for \(R_g = 1\,\text{k}\Omega\), \(R = 24.5\,\text{k}\Omega\), and \(V_{\text{in}} = 20\,\text{mV}\).
Solution:
The differential voltage gain formula for a three-op-amp instrumentation amplifier:
$$A_v = 1 + \frac{2 R}{R_g} = 1 + \frac{2 \times 24\,500\,\Omega}{1000\,\Omega} = 1 + 49 = \mathbf{50.0}$$
The corresponding output voltage:
$$V_{\text{out}} = A_v \times V_{\text{in}} = 50.0 \times 0.020\,\text{V} = \mathbf{1.0\,\text{V}}$$
3. Thermocouple Sensitivity & Voltage Output: Calculate output \(V_{\text{out}}\) for a Type K thermocouple (\(S = 41\,\mu\text{V/}^\circ\text{C}\)) measuring \(T_{\text{hot}} = 250^\circ\text{C}\) with cold junction \(T_{\text{cold}} = 25^\circ\text{C}\).
Solution:
Temperature differential:
$$\Delta T = T_{\text{hot}} - T_{\text{cold}} = 250^\circ\text{C} - 25^\circ\text{C} = 225^\circ\text{C}$$
Thermoelectric Seebeck voltage:
$$V_{\text{out}} = S \times \Delta T = (41 \times 10^{-6}\,\text{V/}^\circ\text{C}) \times 225^\circ\text{C} = 0.009225\,\text{V} = \mathbf{9.225\,\text{mV}}$$
4. Strain Gauge Bridge Unbalance Voltage: Compute unbalance output for a quarter-bridge (\(GF = 2.0\), \(V_{\text{EXC}} = 10\,\text{V}\)) under mechanical strain \(\epsilon = 500\,\mu\epsilon\).
Solution:
Quarter-bridge unbalance equation:
$$V_{\text{out}} = \frac{V_{\text{EXC}}}{4} \times GF \times \epsilon$$
Convert microstrain: \(\epsilon = 500 \times 10^{-6}\):
$$V_{\text{out}} = \frac{10.0\,\text{V}}{4} \times 2.0 \times (500 \times 10^{-6}) = 2.5 \times 2.0 \times 0.0005 = 0.0025\,\text{V} = \mathbf{2.5\,\text{mV}}$$
5. Nyquist Minimum Sampling Rate Calculation: Determine the minimum sampling frequency \(f_s\) for telemetry containing frequencies up to \(f_{\max} = 12.5\,\text{kHz}\).
Solution:
According to the Nyquist-Shannon sampling theorem, avoiding aliasing requires:
$$f_s \ge 2 f_{\max} = 2 \times 12.5\,\text{kHz} = \mathbf{25.0\,\text{kHz}}\quad (25\,000\,\text{samples/second})$$
6. RTD Resistance-Temperature Relationship: Calculate resistance \(R_T\) at \(120^\circ\text{C}\) for a PT100 sensor (\(R_0 = 100\,\Omega\) at \(0^\circ\text{C}\), \(\alpha = 0.00385\,\Omega/\Omega/^\circ\text{C}\)).
Solution:
Linearized Callendar-Van Dusen equation above \(0^\circ\text{C}\):
$$R_T = R_0 (1 + \alpha T) = 100\,\Omega \times [1 + (0.00385 \times 120)]$$
$$R_T = 100 \times [1 + 0.462] = 100 \times 1.462 = \mathbf{146.2\,\Omega}$$
7. Measurement System Error Percentage: An optical pyrometer reads \(842^\circ\text{C}\) against a true reference standard of \(850^\circ\text{C}\). Determine absolute and relative percentage errors.
Solution:
Absolute measurement error:
$$\text{Error}_{\text{abs}} = \text{Measured} - \text{True} = 842^\circ\text{C} - 850^\circ\text{C} = \mathbf{-8.0^\circ\text{C}}$$
Percentage relative error:
$$\text{Error}_{\text{rel}} = \frac{|\text{Error}_{\text{abs}}|}{\text{True}} \times 100\% = \frac{8.0}{850} \times 100\% \approx \mathbf{0.941\%}$$