Mendelian genetics forms the bedrock of classical genetics, offering a systematic framework for understanding how traits are passed from one generation to the next. Rooted in Gregor Mendel’s pioneering experiments with pea plants, it establishes principles of segregation and independent assortment that explain how alleles behave during reproduction. These foundational insights remain relevant in the age of modern science, helping students decode the mechanics of heredity and inheritance across all living organisms. The study of Mendelian laws offers critical tools to predict inheritance patterns and identify carriers of genetic traits, laying the groundwork for more complex analyses in molecular and quantitative domains.
Students exploring Mendelian genetics benefit from understanding its integration with broader concepts in biology and cell biology. The rules of inheritance are intimately linked to the stages of the cell cycle, especially during meiosis when chromosomes segregate. Understanding how traits are inherited requires appreciation of cell structure, particularly the role of chromosomes and alleles. Concepts like cell communication and cell physiology further enrich our understanding of how inherited instructions manifest as phenotypic traits within the body.
Modern developments in genomics and molecular genetics have expanded the reach of Mendelian principles. Tools such as DNA technology and molecular techniques in research allow scientists to investigate allele frequencies and gene interactions at unprecedented depth. These advancements help identify genetic mutations and their link to specific traits, improving our understanding of dominant and recessive inheritance. Mendelian frameworks also clarify how molecular basis of inheritance shapes biological diversity and informs gene expression.
The implications of Mendelian genetics are far-reaching. In fields like applications of genetics in medicines, it aids in diagnosing inherited conditions, designing gene therapies, and predicting disease risk. The understanding of basic units of heredity also influences fields such as protein synthesis, which interprets genetic instructions into functional molecules. Insights from molecular evolution further show how Mendelian inheritance contributes to population variation and natural selection, particularly in the study of population genetics and quantitative genetics.
By bridging early genetic theories with modern biological research, Mendelian genetics remains a cornerstone of scientific education. Its concepts are enriched through connections to topics like ecology and evolutionary biology, where inheritance patterns influence species interactions and biodiversity. Students gain a deeper appreciation of heredity’s complexity and its central role in shaping both individuals and populations. As genetic research continues to evolve, the Mendelian legacy provides a reliable starting point for exploration and innovation in the life sciences.

Classical Genetics: Review Questions and Answers
Question 1:
What were Gregor Mendel’s key experiments, and how did they establish the foundation of Mendelian genetics?
Answer:
Gregor Mendel’s Key Experiments:
Gregor Mendel, often referred to as the “Father of Genetics,” conducted pioneering experiments in the mid-19th century that laid the groundwork for the field of genetics. His experiments focused on pea plants (Pisum sativum) to understand how traits are inherited from one generation to the next.
Key Aspects of Mendel’s Experiments:
Choice of Organism:
- Pea Plants: Mendel selected pea plants due to their distinct varieties, short generation time, and the ability to control pollination, allowing for precise experimentation.
- Controlled Traits: He focused on seven distinct, easily observable traits, such as seed shape, flower color, and pod shape, each with clear dominant and recessive forms.
Monohybrid Crosses:
- Single Trait Analysis: Mendel conducted crosses focusing on one trait at a time, such as plant height (tall vs. short).
- Generation Tracking: He tracked the inheritance of traits across generations, noting the appearance of dominant and recessive phenotypes.
Dihybrid Crosses:
- Two Traits Simultaneously: Mendel extended his experiments to analyze the inheritance of two traits at once, such as seed shape and seed color.
- Independent Assortment: He observed that the inheritance of one trait did not influence the inheritance of another, leading to the principle of independent assortment.
Hybridization Techniques:
- True-Breeding Lines: Mendel began with true-breeding (homozygous) pea plants for specific traits to ensure consistency in trait expression.
- Cross-Pollination: By manually cross-pollinating plants, he controlled the parentage and accurately tracked trait inheritance.
Data Collection and Analysis:
- Statistical Approach: Mendel meticulously recorded the number of offspring exhibiting each phenotype, allowing him to identify consistent ratios.
- Law Formulation: Through his data, Mendel formulated the foundational laws of inheritance.
Establishment of Mendelian Genetics:
Law of Segregation:
- Definition: Each individual possesses two alleles for a given trait, which segregate during gamete formation, ensuring that each gamete carries only one allele.
- Experimental Evidence: Mendel observed a 3:1 phenotypic ratio in the F2 generation of monohybrid crosses, indicating segregation of alleles.
Law of Independent Assortment:
- Definition: Alleles for different traits assort independently of one another during gamete formation.
- Experimental Evidence: In dihybrid crosses, Mendel observed a 9:3:3:1 phenotypic ratio, supporting the independent assortment of alleles.
Dominant and Recessive Traits:
- Dominance: Mendel identified that certain traits (e.g., tall plant height) were dominant over others (e.g., short plant height).
- Recessiveness: Traits that were masked in the presence of dominant alleles became apparent only in homozygous recessive individuals.
Conclusion:
Mendel’s methodical approach, controlled breeding experiments, and rigorous data analysis enabled him to uncover the fundamental principles of genetic inheritance. His work established the foundation of Mendelian genetics, providing a framework that explains how traits are passed from parents to offspring through discrete hereditary units (genes). These principles remain integral to our understanding of genetics today.
Question 2:
Explain the Law of Segregation and provide an example of how it operates in a monohybrid cross.
Answer:
Law of Segregation Defined:
The Law of Segregation, one of Mendel’s foundational principles, states that each individual possesses two alleles for each gene, which segregate (separate) during the formation of gametes (egg and sperm cells). Consequently, each gamete carries only one allele for each gene. This segregation ensures that offspring inherit one allele from each parent, maintaining the diploid nature of organisms.
Key Points:
Diploid Organisms:
- Two Alleles: Most organisms are diploid, meaning they have two sets of chromosomes, and therefore two alleles for each gene—one inherited from each parent.
Gamete Formation:
- Meiosis: During meiosis, homologous chromosomes (and their corresponding alleles) are separated into different gametes, ensuring each gamete receives only one allele per gene.
Random Segregation:
- Independent Separation: The process by which alleles segregate into gametes is random, with each allele having an equal chance of being included in a gamete.
Example of the Law of Segregation in a Monohybrid Cross:
Trait Analyzed: Seed Shape in Pea Plants
- Alleles: R (round seeds, dominant) and r (wrinkled seeds, recessive)
True-Breeding Parents:
- Parent 1 (RR): Homozygous dominant, producing round seeds.
- Parent 2 (rr): Homozygous recessive, producing wrinkled seeds.
F1 Generation:
- Cross: RR (round) × rr (wrinkled)
- Genotype: All offspring are heterozygous (Rr)
- Phenotype: All F1 plants exhibit the dominant trait (round seeds)
F2 Generation:
- Self-Pollination of F1 Plants (Rr × Rr)
- Gametes Produced: Each F1 plant produces two types of gametes, R and r, with equal probability.
Punnett Square Analysis:
| R | r | |
|---|---|---|
| R | RR | Rr |
| r | Rr | rr |
Results:
- Genotypic Ratio: 1 RR : 2 Rr : 1 rr
- Phenotypic Ratio: 3 Round : 1 Wrinkled
Operation of the Law of Segregation:
- Allele Separation: During gamete formation in the F1 generation, the two alleles (R and r) segregate so that each gamete contains only one allele.
- Random Combination: When gametes from two F1 individuals combine during fertilization, the alleles reunite randomly.
- Trait Expression: The resulting phenotypic ratios in the F2 generation reflect the segregation and independent assortment of alleles, demonstrating the Law of Segregation.
Conclusion:
The Law of Segregation explains how offspring inherit one allele for each gene from each parent, maintaining genetic diversity and ensuring the stability of trait ratios across generations. This principle is fundamental to understanding inheritance patterns in monohybrid crosses and forms the basis for predicting genetic outcomes in breeding experiments.
Question 3:
Describe the difference between homozygous and heterozygous genotypes and how they relate to dominant and recessive traits.
Answer:
Homozygous and Heterozygous Genotypes Defined:
Homozygous Genotype:
- Definition: An individual has two identical alleles for a particular gene.
- Notation: Represented by two uppercase (dominant) or two lowercase (recessive) letters (e.g., AA or aa).
- Expression of Traits: Homozygous individuals will consistently express the trait associated with the allele pair.
Heterozygous Genotype:
- Definition: An individual has two different alleles for a particular gene.
- Notation: Represented by one uppercase and one lowercase letter (e.g., Aa).
- Expression of Traits: Heterozygous individuals will express the dominant trait, as the dominant allele masks the recessive allele in the phenotype.
Relation to Dominant and Recessive Traits:
Dominant Allele (A):
- Expression: The dominant allele is expressed in the phenotype even when only one copy is present (in heterozygous genotype).
- Example: In pea plants, the allele for round seeds (R) is dominant over the allele for wrinkled seeds (r). Therefore, both RR and Rr genotypes result in round seeds.
Recessive Allele (a):
- Expression: The recessive allele is expressed in the phenotype only when two copies are present (in homozygous recessive genotype).
- Example: In pea plants, only the aa genotype results in wrinkled seeds. In the heterozygous Rr genotype, the round seed trait is expressed due to the presence of the dominant R allele.
Implications in Trait Expression:
Homozygous Dominant (AA):
- Phenotype: Exhibits the dominant trait.
- Genetic Contribution: Passes the dominant allele (A) to offspring.
Homozygous Recessive (aa):
- Phenotype: Exhibits the recessive trait.
- Genetic Contribution: Passes the recessive allele (a) to offspring.
Heterozygous (Aa):
- Phenotype: Exhibits the dominant trait.
- Genetic Contribution: Passes either the dominant allele (A) or the recessive allele (a) to offspring, each with a 50% probability.
Example in Mendelian Inheritance:
Trait: Flower Color in Pea Plants
- Alleles: P (purple, dominant) and p (white, recessive)
Genotype-Phenotype Relationships:
- PP (Homozygous Dominant): Purple flowers
- Pp (Heterozygous): Purple flowers
- pp (Homozygous Recessive): White flowers
Breeding Scenario:
- Parental Genotypes: PP (purple) × pp (white)
- F1 Generation Genotypes: All Pp (purple)
- F2 Generation Genotypes (from Pp × Pp cross):
- 1 PP : 2 Pp : 1 pp
- Phenotypic Ratio: 3 Purple : 1 White
Conclusion:
Understanding the distinction between homozygous and heterozygous genotypes is crucial for predicting trait inheritance patterns. The interaction between dominant and recessive alleles determines the phenotypic outcomes in offspring, with homozygous genotypes ensuring the consistent expression of a trait and heterozygous genotypes allowing for the presence of both alleles while masking the recessive trait.
Question 4:
How do Punnett squares help predict the probability of offspring inheriting particular genotypes and phenotypes? Provide an example.
Answer:
Punnett Squares Defined:
Punnett squares are graphical tools used in genetics to predict the probability of offspring inheriting specific genotypes and phenotypes based on the genetic makeup of the parents. Named after Reginald Punnett, these squares help visualize the possible combinations of alleles that can result from a cross between two parents.
Function of Punnett Squares:
Allele Representation:
- Parent Alleles: Each parent’s possible alleles for a trait are listed along the top and side of the square.
- Gamete Formation: The alleles represent the different gametes each parent can produce.
Crossing Alleles:
- Combination: Each cell within the square represents a possible genotype of the offspring, formed by combining one allele from each parent.
- Probability Calculation: The frequency of each genotype and phenotype can be determined based on the number of times they appear within the square.
Example of Using a Punnett Square:
Trait: Seed Shape in Pea Plants
- Alleles: R (round, dominant) and r (wrinkled, recessive)
Parental Genotypes:
- Parent 1: Rr (heterozygous, round seeds)
- Parent 2: Rr (heterozygous, round seeds)
Punnett Square Setup:
| R | r | |
|---|---|---|
| R | RR | Rr |
| r | Rr | rr |
Possible Genotypes of Offspring:
RR (Homozygous Dominant):
- Frequency: 1 out of 4 (25%)
- Phenotype: Round seeds
Rr (Heterozygous):
- Frequency: 2 out of 4 (50%)
- Phenotype: Round seeds
rr (Homozygous Recessive):
- Frequency: 1 out of 4 (25%)
- Phenotype: Wrinkled seeds
Phenotypic Ratio:
- Round Seeds: 3 (RR and Rr)
- Wrinkled Seeds: 1 (rr)
- Ratio: 3:1
Interpretation:
- Genotypic Probability: There’s a 25% chance of an offspring being homozygous dominant (RR), a 50% chance of being heterozygous (Rr), and a 25% chance of being homozygous recessive (rr).
- Phenotypic Probability: There’s a 75% chance of an offspring displaying the dominant phenotype (round seeds) and a 25% chance of displaying the recessive phenotype (wrinkled seeds).
Conclusion:
Punnett squares are invaluable for visualizing and calculating the probabilities of different genetic outcomes in offspring. By systematically combining parental alleles, they provide clear predictions of genotype and phenotype distributions, aiding in the understanding of inheritance patterns and genetic probabilities.
Question 5:
What is incomplete dominance, and how does it differ from complete dominance? Provide an example illustrating incomplete dominance.
Answer:
Incomplete Dominance Defined:
Incomplete dominance is a form of inheritance where neither allele is completely dominant over the other. Instead, the heterozygous genotype results in a phenotype that is intermediate between the two homozygous phenotypes. This leads to a blending of traits in the offspring.
Difference from Complete Dominance:
Complete Dominance:
- Allele Interaction: One allele (dominant) completely masks the effect of the other allele (recessive) in the heterozygous genotype.
- Phenotypic Expression: The dominant trait is fully expressed in heterozygotes, with no intermediate phenotype.
- Example: In pea plants, the allele for round seeds (R) is completely dominant over the allele for wrinkled seeds (r). Heterozygous (Rr) plants have round seeds.
Incomplete Dominance:
- Allele Interaction: Neither allele is completely dominant; both alleles contribute to the phenotype in the heterozygous genotype.
- Phenotypic Expression: The heterozygous phenotype is a blend or intermediate of the two homozygous phenotypes.
- Example: In snapdragon flowers, the allele for red flowers (R) and the allele for white flowers (W) exhibit incomplete dominance. Heterozygous (RW) plants produce pink flowers.
Example Illustrating Incomplete Dominance:
Trait: Flower Color in Snapdragon Plants
- Alleles: R (red) and W (white)
Parental Genotypes:
- Parent 1: RR (homozygous red)
- Parent 2: WW (homozygous white)
Punnett Square Setup:
| R | R | |
|---|---|---|
| W | RW | RW |
| W | RW | RW |
Offspring Genotypes:
- All offspring are RW (heterozygous)
Phenotype:
- All offspring exhibit pink flowers, an intermediate phenotype between red and white.
F1 Generation:
- Genotype: RW
- Phenotype: Pink flowers
F2 Generation (Self-Pollination of RW × RW):
| R | W | |
|---|---|---|
| R | RR | RW |
| W | RW | WW |
Offspring Genotypes:
- 1 RR : 2 RW : 1 WW
Phenotypic Ratio:
- 1 Red : 2 Pink : 1 White
Conclusion:
Incomplete dominance results in a third phenotype that is a blend of the two parental traits, demonstrating that the alleles contribute partially to the phenotype. This contrasts with complete dominance, where the dominant allele fully masks the recessive allele in heterozygotes. Incomplete dominance adds complexity to genetic inheritance patterns, highlighting the diverse ways traits can be expressed in organisms.
Question 6:
How does linkage affect the inheritance of genes, and what are linkage maps? Provide an example of linked genes.
Answer:
Linkage Defined:
Linkage refers to the tendency of genes located close to each other on the same chromosome to be inherited together during meiosis. Unlike genes located on different chromosomes, which assort independently according to Mendel’s Law of Independent Assortment, linked genes do not independently segregate if they are physically close to each other on the same chromosome.
Impact of Linkage on Inheritance:
Reduced Recombination:
- Close Proximity: Genes that are close to each other on a chromosome are less likely to be separated by crossing over during meiosis.
- Inheritance Patterns: Linked genes tend to be inherited as a unit, leading to fewer recombinant (new allele combinations) offspring compared to unlinked genes.
Deviation from Mendelian Ratios:
- Non-Independent Assortment: The inheritance of one gene affects the probability of inheriting another linked gene, causing deviations from the expected Mendelian phenotypic ratios.
Linkage Maps Defined:
Linkage maps are genetic maps that display the relative positions of genes or genetic markers on a chromosome based on the frequency of recombination between them. The closer two genes are on a chromosome, the lower the recombination frequency, indicating closer linkage.
Construction of Linkage Maps:
Genetic Markers:
- Selection: Use identifiable genetic markers (e.g., SNPs, microsatellites) to track inheritance patterns.
Recombination Frequency:
- Calculation: Determine the recombination frequency between pairs of markers by analyzing the proportion of recombinant offspring.
- Distance Measurement: Recombination frequency is used to estimate the genetic distance between markers, typically expressed in centimorgans (cM).
Map Ordering:
- Sequence Arrangement: Arrange markers in order on the linkage map based on their recombination frequencies, with lower frequencies indicating closer proximity.
Example of Linked Genes:
Trait Analyzed: Coat Color and Eye Color in Mice
- Genes:
- Gene A: Controls coat color (A = agouti, a = black)
- Gene B: Controls eye color (B = brown, b = blue)
Parental Genotypes:
- Parent 1: AaBb (agouti, brown eyes)
- Parent 2: aaBb (black coat, brown eyes)
Observation:
- Linkage Assumption: Genes A and B are located close to each other on the same chromosome.
Expected Inheritance Patterns:
- Non-Recombinant Gametes: AB and ab (parental combinations)
- Recombinant Gametes: Ab and aB (new combinations due to crossing over)
Offspring Phenotypes:
- Higher Frequency of Parental Phenotypes: More agouti with brown eyes and black with brown eyes.
- Lower Frequency of Recombinant Phenotypes: Agouti with blue eyes and black with blue eyes.
Linkage Map Example:
- Gene A and Gene B: Positioned 10 cM apart on the same chromosome.
- Interpretation: A 10% recombination frequency indicates that the genes are relatively close, resulting in linkage and a higher probability of parental allele combinations being inherited together.
Conclusion:
Linkage influences the inheritance of genes by causing physically proximate genes on the same chromosome to be inherited together, thereby deviating from independent assortment. Linkage maps provide a valuable tool for understanding the genetic architecture of organisms, aiding in gene mapping, identification of disease genes, and studying evolutionary relationships. Recognizing linkage is essential for accurate genetic prediction and analysis, particularly in traits controlled by multiple genes.
Question 7:
What is epistasis, and how does it differ from simple dominance? Provide an example of epistatic interaction between two genes.
Answer:
Epistasis Defined:
Epistasis is a form of genetic interaction where the expression of one gene (the epistatic gene) masks or modifies the expression of another gene (the hypostatic gene). Unlike simple dominance, where one allele masks another allele at the same gene locus, epistasis involves interactions between different gene loci affecting the phenotype.
Difference from Simple Dominance:
Simple Dominance:
- Single Gene Interaction: Occurs within a single gene locus where one allele (dominant) masks the expression of another allele (recessive).
- Phenotypic Outcome: The dominant allele’s trait is expressed in heterozygotes, while the recessive allele’s trait is only expressed in homozygotes.
Epistasis:
- Multiple Gene Interaction: Involves interactions between different gene loci where one gene influences the expression of another.
- Phenotypic Outcome: The epistatic gene can suppress or alter the expression of the hypostatic gene, leading to modified phenotypic ratios.
Types of Epistasis:
Recessive Epistasis:
- Mechanism: Homozygous recessive alleles at the epistatic gene locus mask the expression of alleles at the hypostatic gene locus.
- Example: Coat color in Labrador Retrievers (B and E genes).
Dominant Epistasis:
- Mechanism: Dominant alleles at the epistatic gene locus mask the expression of alleles at the hypostatic gene locus.
- Example: Summer squash fruit color.
Duplicate Recessive Epistasis:
- Mechanism: Two different genes have recessive alleles that independently mask a particular phenotype when homozygous recessive.
- Example: Flower color in some plants.
Duplicate Dominant Epistasis:
- Mechanism: Two different genes have dominant alleles that independently mask a particular phenotype when either is dominant.
- Example: Epistasis in mouse coat color.
Example of Epistatic Interaction:
Trait Analyzed: Coat Color in Labrador Retrievers
- Genes Involved:
- Gene B: Controls the production of eumelanin (black/brown pigment).
- B (black): Dominant allele producing black pigment.
- b (brown): Recessive allele producing brown pigment.
- Gene E: Controls the deposition of pigment in the fur.
- E (allows pigment deposition): Dominant allele permits black or brown pigment expression.
- e (prevents pigment deposition): Recessive allele masks pigment production, resulting in yellow fur regardless of alleles at Gene B.
- Gene B: Controls the production of eumelanin (black/brown pigment).
Genotype-Phenotype Relationships:
B_E_ (BBEE, BBEe, BbEE, BbEe):
- Phenotype: Black coat (dominant B allele expressed).
bbE_ (bbEE, bbEe):
- Phenotype: Brown coat (recessive b allele expressed).
__ee (BBee, Bbee, bbee):
- Phenotype: Yellow coat (epistatic gene E masks the expression of Gene B).
Punnett Square Analysis (Example Cross):
Parental Genotypes:
- Parent 1: BbEe (black coat)
- Parent 2: BbEe (black coat)
Gametes Produced by Each Parent:
- Parent 1 and Parent 2: BE, Be, bE, be
Punnett Square Setup:
| BE | Be | bE | be | |
|---|---|---|---|---|
| BE | BBEE | BBEe | BbEE | BbEe |
| Be | BBEe | BBee | BbEe | Bbee |
| bE | BbEE | BbEe | bbEE | bbEe |
| be | BbEe | Bbee | bbEe | bbee |
Offspring Genotypes and Phenotypes:
BBEE, BBEe, BbEE, BbEe:
- Phenotype: Black coat
- Frequency: 9 out of 16
bbEE, bbEe:
- Phenotype: Brown coat
- Frequency: 3 out of 16
BBee, Bbee, bbEe, bbee:
- Phenotype: Yellow coat
- Frequency: 4 out of 16
Phenotypic Ratio:
- 9 Black : 3 Brown : 4 Yellow
Interpretation of Epistasis:
- Gene E’s Role: The presence of at least one dominant E allele allows the expression of pigment, with the B allele determining black or brown color. However, when an individual is homozygous recessive (ee) at Gene E, no pigment is deposited, resulting in a yellow coat regardless of the alleles present at Gene B.
- Epistatic Effect: Gene E is epistatic to Gene B, as it masks the expression of Gene B in the ee genotype.
Conclusion:
Epistasis demonstrates the complexity of genetic interactions beyond simple dominance. Understanding epistatic relationships is crucial for accurately predicting phenotypic outcomes and unraveling the intricate mechanisms of trait inheritance. This example in Labrador Retrievers illustrates how one gene can influence the expression of another, leading to modified phenotypic ratios that deviate from classic Mendelian expectations.
Question 8:
What are pedigrees, and how are they used to determine the mode of inheritance of a particular trait? Provide an example of a simple pedigree analysis.
Answer:
Pedigrees Defined:
Pedigrees are graphical representations of family relationships that display the occurrence and inheritance patterns of specific traits or genetic disorders across multiple generations. They are used in genetics to trace the transmission of alleles and to determine the mode of inheritance (autosomal dominant, autosomal recessive, X-linked dominant, X-linked recessive, etc.) of a particular trait.
Components of a Pedigree:
Symbols:
- Squares: Represent males.
- Circles: Represent females.
- Filled Symbols: Indicate individuals expressing the trait.
- Unfilled Symbols: Indicate individuals not expressing the trait.
- Half-filled Symbols: Indicate carriers (heterozygous for a trait in recessive conditions).
Lines:
- Horizontal Lines: Connect mates or parents.
- Vertical Lines: Connect parents to their offspring.
Uses of Pedigrees:
Determining Inheritance Patterns:
- Dominant vs. Recessive: Identifying whether a trait is dominant or recessive based on its appearance across generations.
- Autosomal vs. X-Linked: Distinguishing between autosomal and X-linked inheritance by analyzing trait distribution between genders and across generations.
Identifying Carriers:
- Recessive Traits: Detecting individuals who carry one copy of a recessive allele but do not express the trait.
Predicting Genetic Risks:
- Family Planning: Assessing the likelihood of offspring inheriting a genetic disorder based on parental genotypes and family history.
Example of a Simple Pedigree Analysis:
Trait Analyzed: Huntington’s Disease
- Mode of Inheritance: Autosomal dominant
Pedigree Layout:
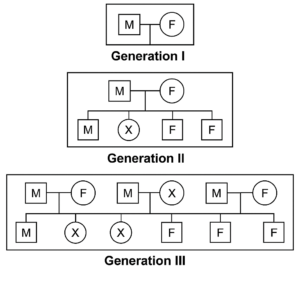
- M: Male
- F: Female
- X: Individual expressing Huntington’s Disease
Analysis:
Transmission Pattern:
- Affected Individuals: Represented by filled symbols (X).
- Affected Parents: Must carry at least one dominant allele (Hh or HH).
- Unaffected Parents: Must be homozygous recessive (hh).
Inheritance Insights:
- Vertical Transmission: The trait appears in every generation, indicating a dominant pattern.
- Both Genders Affected Equally: Suggests an autosomal (non-sex-linked) inheritance.
- Affected Parent with Unaffected Parent: Each child has a 50% chance of inheriting the trait, consistent with autosomal dominant inheritance.
Carrier Identification:
- Dominant Traits: Carriers typically express the trait; thus, all individuals with the trait are carriers.
Conclusion of Pedigree Analysis:
Based on the pedigree, Huntington’s Disease is inherited in an autosomal dominant manner. The presence of the trait in every generation, equal distribution among males and females, and the 50% transmission rate from affected parents to offspring support this mode of inheritance. Pedigree analysis is a powerful tool for elucidating the genetic basis of traits and assessing the risk of hereditary conditions within families.
Question 9:
What is incomplete dominance, and how does it differ from codominance? Provide an example of each.
Answer:
Incomplete Dominance Defined:
Incomplete dominance is a genetic phenomenon where neither allele is completely dominant over the other. In heterozygous individuals, the phenotype is an intermediate blend of the two homozygous phenotypes, resulting in a “partial” expression of both traits.
Codominance Defined:
Codominance is a genetic scenario where both alleles in a heterozygous individual are fully expressed simultaneously, resulting in a phenotype that distinctly shows both traits without blending.
Differences Between Incomplete Dominance and Codominance:
Phenotypic Expression:
- Incomplete Dominance: Results in a blended or intermediate phenotype.
- Codominance: Results in both alleles being fully and simultaneously expressed in the phenotype.
Allele Interaction:
- Incomplete Dominance: One allele does not mask the other; instead, both contribute to the phenotype.
- Codominance: Both alleles contribute equally and distinctly to the phenotype.
Examples:
Incomplete Dominance Example: Flower Color in Snapdragon Plants
- Alleles: R (red) and r (white)
- Genotypes and Phenotypes:
- RR (homozygous dominant): Red flowers
- Rr (heterozygous): Pink flowers (intermediate phenotype)
- rr (homozygous recessive): White flowers
- Explanation: The heterozygous Rr genotype results in pink flowers, a blend of red and white, demonstrating incomplete dominance.
Codominance Example: Blood Type AB in Humans
- Alleles: IA and IB (both codominant)
- Genotypes and Phenotypes:
- IAIA or IAi: Blood type A
- IBIB or IBi: Blood type B
- IAIB: Blood type AB
- ii: Blood type O
- Explanation: Individuals with the IAIB genotype express both A and B antigens on their red blood cells, resulting in blood type AB. Neither allele masks the other; both are fully and distinctly expressed, demonstrating codominance.
Conclusion:
Incomplete dominance and codominance are both forms of non-Mendelian inheritance that involve interactions between alleles beyond simple dominance. While incomplete dominance leads to blended phenotypes, codominance results in the simultaneous and distinct expression of both alleles. Understanding these concepts is essential for accurately predicting and interpreting complex inheritance patterns in various organisms.
Question 10:
How can linkage maps be used to identify the location of genes associated with specific traits or diseases? Provide an example of how a linkage map was instrumental in gene discovery.
Answer:
Linkage Maps Defined:
Linkage maps, also known as genetic maps, are diagrams that display the relative positions of genes or genetic markers on a chromosome based on the frequency of recombination between them. The closer two genes are on a chromosome, the lower the likelihood of recombination occurring between them during meiosis, indicating closer linkage.
Use of Linkage Maps in Gene Identification:
Identifying Candidate Regions:
- Recombination Frequency: By analyzing the recombination frequencies between genetic markers and a trait of interest, researchers can identify regions of the genome that co-segregate with the trait.
- Marker-Trait Association: High co-segregation suggests that the gene responsible for the trait is located near the linked markers.
Narrowing Down Gene Locations:
- Fine Mapping: Once a candidate region is identified, additional markers within that region can be analyzed to narrow down the specific location of the gene.
- Physical Mapping Correlation: Linkage maps can be integrated with physical maps (actual DNA sequences) to pinpoint the exact genomic location.
Facilitating Gene Discovery:
- Positional Cloning: Linkage maps enable the positional cloning approach, where genes are isolated based on their location on the linkage map rather than their function.
- Marker-Assisted Selection: In agriculture, linkage maps help in identifying genes associated with desirable traits, facilitating selective breeding.
Example of Linkage Map in Gene Discovery:
Disease Analyzed: Cystic Fibrosis
- Gene Identified: CFTR (Cystic Fibrosis Transmembrane Conductance Regulator)
Process:
Initial Observations:
- Clinical Presentation: Cystic fibrosis is characterized by thick mucus production affecting the lungs and digestive system.
- Genetic Basis: It is an autosomal recessive disorder, suggesting that the disease gene is located on one of the non-sex chromosomes.
Linkage Analysis:
- Family Studies: Researchers conducted linkage studies involving families affected by cystic fibrosis.
- Genetic Markers: Multiple genetic markers across different chromosomes were analyzed to find those that co-segregated with the disease phenotype.
Identification of Linked Chromosome:
- Chromosome 7: Through linkage analysis, significant linkage was observed between cystic fibrosis and markers on chromosome 7.
- Recombination Frequency: Low recombination frequencies between the disease trait and markers on chromosome 7 indicated close linkage.
Narrowing Down the Region:
- Fine Mapping: Additional markers within chromosome 7 were analyzed, progressively narrowing the candidate region.
Gene Cloning:
- Positional Cloning: Using the refined linkage map, researchers isolated and cloned the CFTR gene located within the identified region.
- Mutation Identification: Multiple mutations within the CFTR gene were discovered, confirming its role in cystic fibrosis.
Impact:
- Diagnostic Testing: Identification of CFTR mutations enabled genetic testing for cystic fibrosis carriers and affected individuals.
- Therapeutic Development: Understanding the CFTR gene function paved the way for targeted therapies aimed at correcting the defective protein.
- Genetic Counseling: Linkage maps facilitated accurate risk assessment for families affected by cystic fibrosis.
Conclusion:
Linkage maps are essential tools in genetic research, enabling the identification and localization of genes associated with specific traits or diseases. The successful discovery of the CFTR gene through linkage mapping exemplifies how genetic linkage analysis can lead to significant advancements in understanding, diagnosing, and treating genetic disorders. Linkage maps continue to play a crucial role in gene discovery, personalized medicine, and the advancement of genetic sciences.
Question 11:
What is the difference between genotype and phenotype? How can environmental factors influence phenotype without altering genotype? Provide examples.
Answer:
Genotype and Phenotype Defined:
Genotype:
- Definition: The genetic makeup of an organism; the specific set of alleles inherited from the parents for a particular gene or set of genes.
- Representation: Denoted by letters (e.g., AA, Aa, aa) indicating the combination of alleles.
- Inheritance: Genotype is inherited from parents and remains constant throughout an organism’s life unless altered by mutation or genetic engineering.
Phenotype:
- Definition: The observable physical, biochemical, or behavioral traits of an organism resulting from the interaction of its genotype with the environment.
- Examples: Height, eye color, blood type, enzyme activity, and behavioral tendencies.
- Variation: Phenotype can vary within a species due to genetic differences and environmental influences.
Difference Between Genotype and Phenotype:
- Genotype: Refers to the internal genetic instructions.
- Phenotype: Refers to the external expression of those instructions.
- Influence: Genotype provides the blueprint, while phenotype is the manifestation influenced by genotype and environment.
Environmental Influence on Phenotype Without Altering Genotype:
Environmental factors can significantly impact the expression of traits without changing the underlying genetic code. These influences can modify the phenotype by affecting gene expression, protein function, or developmental processes.
Examples:
Height in Humans:
- Genotype: Determined by multiple genes that influence growth.
- Phenotype: Height can be affected by environmental factors such as nutrition, health during childhood, and physical activity.
- Explanation: Adequate nutrition during developmental years can maximize an individual’s genetic potential for height, while malnutrition can result in shorter stature despite having genes for taller height.
Skin Pigmentation:
- Genotype: Determined by genes regulating melanin production.
- Phenotype: Skin color can be influenced by environmental factors like sun exposure.
- Explanation: Increased exposure to ultraviolet (UV) radiation can stimulate melanin production, leading to tanning, even if the individual’s genotype predisposes them to lighter skin.
Plant Flowering Time:
- Genotype: Genes regulate the timing of flowering based on internal signals.
- Phenotype: Flowering can be influenced by environmental factors such as temperature, light duration (photoperiod), and soil conditions.
- Explanation: A plant with genes for early flowering may delay flowering if exposed to unfavorable temperatures or insufficient daylight, demonstrating environmental modulation of phenotype.
Behavioral Traits in Animals:
- Genotype: Genes influence predispositions towards certain behaviors.
- Phenotype: Behaviors can be shaped by environmental stimuli, training, and social interactions.
- Explanation: A dog genetically predisposed to be aggressive may not exhibit aggressive behavior if raised in a nurturing and well-trained environment, illustrating the role of environment in phenotype expression.
Epigenetic Mechanisms:
Beyond direct environmental influences, epigenetic modifications provide a molecular basis for how the environment can affect phenotype without altering genotype. These include:
DNA Methylation:
- Effect: Addition of methyl groups to DNA can repress gene expression.
- Example: Environmental stress can lead to methylation changes in stress-response genes, altering an organism’s stress tolerance.
Histone Modification:
- Effect: Chemical modifications to histone proteins can either promote or inhibit gene expression by altering chromatin structure.
- Example: Exposure to toxins can result in histone acetylation changes, affecting the expression of detoxifying enzymes.
Conclusion:
Genotype and phenotype represent the genetic blueprint and its observable manifestation, respectively. While genotype remains relatively stable, phenotype is dynamic and can be influenced by a myriad of environmental factors. Understanding the interplay between genetics and environment is crucial for comprehensively studying trait expression, development, and the complexity of living organisms.
Question 12:
How do genetic mutations differ from epigenetic modifications, and what roles do they play in evolution and disease? Provide examples of each.
Answer:
Genetic Mutations vs. Epigenetic Modifications:
Genetic Mutations:
- Definition: Permanent changes in the DNA sequence of an organism’s genome. They can occur spontaneously during DNA replication or be induced by external factors such as radiation, chemicals, or viruses.
- Types: Point mutations (substitutions, insertions, deletions), frameshift mutations, nonsense mutations, missense mutations, and structural mutations (duplications, inversions, translocations).
- Impact: Can alter gene function, lead to new traits, cause genetic disorders, or be neutral with no effect on the phenotype.
- Inheritance: Mutations are heritable if they occur in germ cells (sperm or eggs), affecting future generations.
Epigenetic Modifications:
- Definition: Heritable changes in gene expression that do not involve alterations to the underlying DNA sequence. These modifications regulate how genes are turned on or off and are influenced by environmental factors.
- Types: DNA methylation, histone modification, non-coding RNA-mediated regulation, and chromatin remodeling.
- Impact: Can influence gene expression levels, modify phenotypic traits, affect development, and play roles in diseases. Unlike mutations, epigenetic changes are often reversible.
- Inheritance: Some epigenetic marks can be passed from one generation to the next, though they are generally not as stable as genetic mutations.
Roles in Evolution and Disease:
Genetic Mutations:
In Evolution:
- Source of Genetic Variation: Mutations introduce new alleles into a population, providing the raw material for natural selection.
- Adaptive Traits: Beneficial mutations can confer advantages that enhance survival and reproductive success, leading to their prevalence in the population.
- Speciation: Accumulation of mutations over time can lead to genetic divergence between populations, contributing to the formation of new species.
In Disease:
- Genetic Disorders: Mutations can cause inherited diseases such as cystic fibrosis, sickle cell anemia, and Huntington’s disease.
- Cancer: Somatic mutations in genes regulating cell growth and division can lead to uncontrolled cell proliferation and tumor formation.
- Antibiotic Resistance: Mutations in bacterial genes can confer resistance to antibiotics, posing significant public health challenges.
Examples:
- Sickle Cell Mutation (HBB gene): A point mutation causing the substitution of valine for glutamic acid in the hemoglobin protein, leading to sickle cell disease.
- BRCA1 and BRCA2 Mutations: Mutations in these genes increase the risk of breast and ovarian cancers by impairing DNA repair mechanisms.
Epigenetic Modifications:
In Evolution:
- Phenotypic Plasticity: Epigenetic changes allow organisms to adapt to environmental changes without altering their genetic code, facilitating rapid responses to shifting conditions.
- Inheritance of Traits: Some epigenetic modifications can be inherited, providing a mechanism for traits to be passed down that are influenced by environmental factors experienced by previous generations.
In Disease:
- Cancer: Aberrant DNA methylation and histone modifications can silence tumor suppressor genes or activate oncogenes, contributing to cancer development.
- Neurological Disorders: Epigenetic dysregulation is implicated in diseases like Alzheimer’s, schizophrenia, and Rett syndrome, affecting neuronal function and brain development.
- Metabolic Disorders: Changes in epigenetic marks can influence genes involved in metabolism, contributing to conditions like obesity and diabetes.
Examples:
- DNA Methylation in Cancer: Hypermethylation of the promoter region of the MLH1 gene leads to its silencing, impairing DNA mismatch repair and contributing to colorectal cancer.
- Histone Modification in Rett Syndrome: Mutations in the MECP2 gene affect the binding to methylated DNA, altering histone acetylation and disrupting neuronal gene expression.
Conclusion:
Genetic mutations and epigenetic modifications are distinct yet interconnected mechanisms that influence an organism’s phenotype, evolution, and susceptibility to diseases. While mutations alter the genetic code itself, epigenetic modifications regulate gene expression without changing the underlying DNA sequence. Both play crucial roles in generating genetic diversity, enabling adaptation, and contributing to the development and progression of various diseases. Understanding these processes is essential for advancing fields such as evolutionary biology, medicine, and genetics.