

Analytical Reflection: Quantum Inversion of the Photospheric Flux
Suggested Analytical Response: Starlight carries highly structured information due to the micro-physical interaction of photons with quantized atomic states within the stellar atmosphere:
1. Bound-Bound Quantum Transitions: Continuous blackbody radiation originating from the high-optical-depth layers must pass through the cooler, less dense gas of the upper photosphere. Photons with energies matching the exact difference between two electron orbitals ($\Delta E = h\nu$) are absorbed by local atoms and ions. When these excited states decay, the photons are re-emitted isotropically, creating a localized deficit of flux along the observer’s line of sight, manifesting as dark absorption lines that act as element-specific chemical fingerprints.
2. Thermodynamic State Calibration: The strength and ionization state of these spectral lines are governed by the local temperature and electron pressure grids, calculated quantitatively by coupling the Boltzmann and Saha ionization equations. This allows astrophysicists to invert the observed line ratios to determine the absolute effective temperature ($T_{\text{eff}}$) and surface gravity ($\log g$) of the plasma matrix.
3. Kinematic Vector Modulation: Macroscale physical modifications shift these line profiles. Bulk radial velocities compress or expand the wave vectors, driving measurable Doppler shifts ($\frac{\Delta \lambda}{\lambda_0} = \frac{v}{c}$) that reveal the star’s spatial motion and atmospheric oscillations, while high-velocity rotations or thermal gas motions broaden the line shapes to provide insights into stellar rotation and turbulence.
Light Emission and Observable Signatures
Stellar Physics Core Frameworks
Establishes the macroscale mathematical models of stellar interiors, defining how mechanical equilibrium and local thermodynamic state grids dictate the global radiative flux that eventually escapes through the atmospheric boundary layer.Stellar Atmospheres and Spectroscopy
Investigates the micro-physical processes of radiative transfer, applying quantum atomic physics, absorption cross-sections, and line broadening tensors to invert escaping light into calculations of chemical abundances, kinematics, and surface gravities.Variable Stars and Stellar Oscillations
Analyzes time-resolved spectral line profile variations and Doppler velocity displacements, using asteroseismic wave propagation to directly audit the hydrodynamic pulsations and internal structural reconfigurations of active stars.Nuclear Fusion Mechanics
Links the emerging atmospheric bolometric flux back to its micro-physical source: the subatomic quantum tunneling kinetics and core temperature-sensitive reaction networks that produce the primary energy driving stellar engines.Stellar Nucleosynthesis Networks
Decodes the elemental abundance traces embedded as absorption features within the photosphere, providing empirical evidence of the successive alpha-capture chains and neutron-capture tracks that alter cosmic matter.Star Life Cycles
Tracks the historical evolution of stellar spectra across the Hertzsprung-Russell diagram, evaluating how a system’s atmospheric parameters, mass-loss wind opacities, and molecular line tracers shift as it moves from protostellar birth to terminal states.Stellar Remnants: Neutron Stars and White Dwarfs
Examines the highly modified spectral properties of non-fusing compact remnants, using extreme pressure broadening, molecular Zeeman splittings, and gravitational redshifts to validate equations of state under ultra-dense regimes.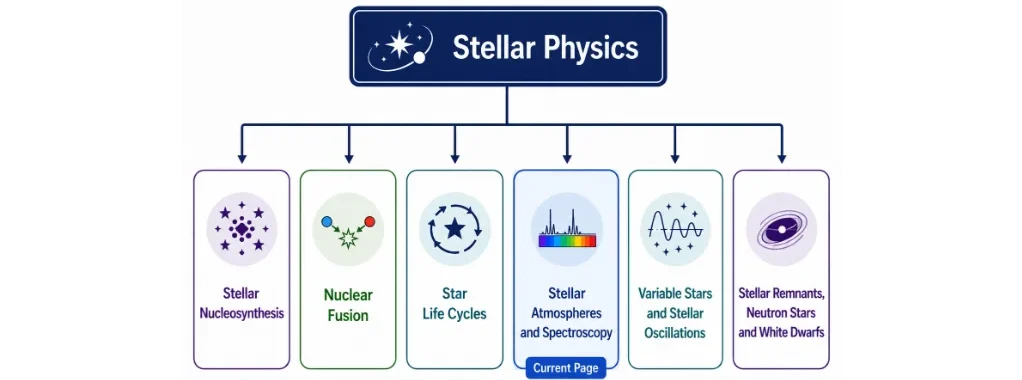
This structure chart presents Stellar Physics as the parent topic and shows its related child pages: Stellar Nucleosynthesis, Nuclear Fusion, Star Life Cycles, Stellar Atmospheres and Spectroscopy, Variable Stars and Stellar Oscillations, and Stellar Remnants Neutron Stars and White Dwarfs. Stellar Atmospheres and Spectroscopy is highlighted as the current page, helping students understand how the study of stellar light, spectra, composition, temperature, and atmospheric layers fits within the broader Stellar Physics cluster.
Structure of Stellar Atmospheres
The Photosphere
The Chromosphere
The Corona
Analytical Reflection: Decoupling the Layer Signatures
Suggested Analytical Response: The distinct spectral profiles are direct products of the stratified atmospheric layers:
1. Photospheric Absorption: The dark absorption lines are carved at the optical depth interface (\(\tau \approx 2/3\)) of the photosphere, where the escaping continuous blackbody flux passes through cooler, low-pressure gas, driving bound-bound quantum absorption states.
2. Chromospheric Emission: The reddish glow originates within the chromosphere, where non-LTE conditions and mechanical heating elevate gas temperatures enough to populate the \(n=3\) state of hydrogen, driving a high-frequency \(\text{H}\alpha\) (\(3 \rightarrow 2\)) Balmer emission channel.
3. Coronal High-Energy Flux: The X-ray emission is generated deep within the corona, where magnetic reconnection loops pump temperatures past \(T \ge 10^6\,\text{K}\). This high thermal energy strips valence electrons from heavy metals, generating high-energy bremsstrahlung and characteristic X-ray line emissions from highly ionized atomic states.
Spectral Analysis and Stellar Spectroscopy
Spectral Lines
Doppler Effect and Radial Velocity Kinetics
The Zeeman Effect
Quick Check: Decoding the Integrated Spectrum
1. Fraunhofer Absorption lines: Prove the presence of specific atomic or ionic species inside the cooler layers of the photosphere, where incoming photons match bound-bound electronic excitation paths.
2. Periodic Doppler Shifts: Indicate that the star possesses a variable radial velocity vector, revealing center-of-mass orbital motion driven by a binary stellar companion or an orbiting exoplanet.
3. Refined Zeeman Component Splitting: Confirms the presence of intense magnetic fields breaking the quantum degeneracy of electron energy states, allowing for the direct calculation of localized magnetic flux tensors.
Chemical Composition Analysis
Analytical Reflection: The Ionization Balance Paradox
1. Thermodynamic Phase Modulation: The appearance of molecular bands (such as \(\text{TiO}\)) proves that the second star features a significantly lower effective surface temperature (\(T_{\text{eff}} \le 3{,}800\,\text{K}\)). In high-temperature atmospheres, intense kinetic impacts break molecular bonds; cool atmospheres permit these bonds to persist, allowing complex vibrational and rotational transitions to absorb light.
2. Excitation Mechanics: The variation in metal lines is heavily driven by the temperature-dependent Boltzmann distribution. In cool stars, neutral iron (\(\text{Fe I}\)) and low-ionization states dominate because the thermal energy is insufficient to strip valence electrons, driving strong low-excitation lines despite identical underlying abundances.
3. Evolutionary Metallicity Fingerprinting: If a rigorous thermodynamic inversion proves that the metal line disparity persists after correcting for temperature, it marks a fundamental difference in metallicity (\([\text{Fe}/\text{H}]\)). The metal-rich star belongs to a younger cosmic generation formed from an interstellar medium highly enriched by earlier supernova nucleosynthesis events, whereas the metal-poor star tracks the pristine chemical signatures of an older cosmic epoch.
Spectral Classification and Thermodynamic Diagnostics
The Harvard Spectral Classification Framework
| Spectral Class | Effective Temperature (\(T_{\text{eff}}\), K) | Continuum Color | Dominant Quantum Spectral Features |
|---|---|---|---|
| O | \(30{,}000 \rightarrow 50{,}000\) | Blue | Singly ionized helium (\(\text{He II}\)) absorption; highly ionized nitrogen and oxygen; exceptionally weak neutral hydrogen (\(\text{H I}\)) Balmer profiles. |
| B | \(10{,}000 \rightarrow 30{,}000\) | Blue-White | Neutral helium (\(\text{He I}\)) features achieve peak equivalent widths; neutral hydrogen lines scale from moderate to highly pronounced intensity profiles. |
| A | \(7{,}500 \rightarrow 10{,}000\) | White | Neutral hydrogen Balmer series (\(\text{H I}\)) achieve maximum absolute equivalent widths; singly ionized metals (\(\text{Mg II}\), \(\text{Si II}\)) begin to emerge. |
| F | \(6{,}000 \rightarrow 7{,}500\) | Yellow-White | Hydrogen lines undergo rapid weakening; singly ionized calcium (\(\text{Ca II}\) H and K lines) and neutral metal profiles become highly prominent. |
| G | \(5{,}200 \rightarrow 6{,}000\) | Yellow | Dominant \(\text{Ca II}\) H and K absorption; neutral metal lines (\(\text{Fe I}\), \(\text{Cr I}\)) dominate the opacity; hydrogen Balmer features are heavily suppressed. |
| K | \(3{,}700 \rightarrow 5{,}200\) | Orange | Intense neutral metal line networks dominate the entire optical spectrum; molecular bands (such as the \(\text{CH}\) G-band) initiate visible absorption trends. |
| M | \(2{,}400 \rightarrow 3{,}700\) | Red | Complex molecular absorption bands—predominantly titanium oxide (\(\text{TiO}\))—cause severe continuum line blanketing; neutral metal lines remain deep. |
The Morgan-Keenan (MK) Luminosity Classification
| Luminosity Class | Astrophysical Structural Profile | Empirical Representative Baseline |
|---|---|---|
| I (Ia / Ib) | Supergiants: Extended, ultra-low density envelopes; minimal surface gravity indices (\(\log g \approx 0 \rightarrow 1\)); exceptionally sharp line widths. | Betelgeuse (M1 Ia) Rigel (B8 Ia) |
| II | Bright Giants: Intermediate post-main-sequence structural reconfigurations bridging the giant and supergiant domains. | Canopus (A9 II) |
| III | Giants: Evolved post-main-sequence systems actively undergoing core helium or shell hydrogen burning stages. | Aldebaran (K5 III) |
| IV | Subgiants: Core hydrogen depleted; transitioning off the main sequence along Kelvin-Helmholtz thermal expansion tracks. | Gamma Cephei (K1 IV) |
| V | Main-Sequence Stars: Dense, steady-state core hydrogen-fusing dwarf configurations maintaining stable hydrostatic equilibrium. | The Sun (G2 V) |
| VI | Subdwarfs: Metal-poor Population II stars exhibiting lower opacities that displace them below the standard main-sequence baseline. | Kapteyn’s Star (sdM1) |
| VII | White Dwarfs: Compact, non-fusing, electron-degenerate remnants displaying extreme collisional Stark broadening signatures. | Sirius B (DA2) |
Quick Check: Decoding a Stellar Classification Code
1. Thermodynamic Core Calibration (G2): The G2 subclass anchors the star’s effective surface temperature at \(T_{\text{eff}} \approx 5778\,\text{K}\). At this thermal threshold, the gas kinetic energy favors neutral metal absorption lines—specifically neutral iron (\(\text{Fe I}\)) and singly ionized calcium (\(\text{Ca II}\)) K lines—while the thermal velocity is too low to maintain the hydrogen Balmer line strengths observed in hotter A-type stars.
2. Hydrodynamic Enclosure Profile (V): The Roman numeral V designates a main-sequence dwarf configuration. This proves that the star features a high surface gravity (\(\log g \approx 4.44\,\text{cgs}\)), which drives elevated particle collision frequencies within the photosphere, generating pronounced Stark line wing broadening. Mechanically, it proves that the core remains locked in long-term hydrostatic equilibrium sustained by core hydrogen fusion.
Applications of Stellar Spectroscopy
Determining Stellar Properties
Studying Stellar Activity and Magnetohydrodynamics
Stellar Evolution and Lifecycle Tracking
Exoplanet Detection and Atmospheric Characterization
- The Radial Velocity Method: By measuring periodic, high-precision Doppler shifts in a star’s photospheric absorption lines, physicists detect the gravitational wobble induced by an orbiting exoplanet. This periodic modulation isolates the planet’s orbital period, eccentricity, and lower mass boundary (\(M \sin i\)).
- Transit Transmission Spectroscopy: When an exoplanet passes directly in front of the stellar disk, a fraction of the photospheric flux filters through the planet’s thin atmospheric envelope. By subtracting the out-of-transit stellar spectrum from the in-transit spectrum, astronomers isolate the minute absorption signatures carved by the planet’s atmosphere, identifying chemical species such as water vapor (\(\text{H}_2\text{O}\)), carbon dioxide (\(\text{CO}_2\)), methane (\(\text{CH}_4\)), and vaporized metals.
Analytical Reflection: Deconstructing Multi-Layered Spectral Signals
1. Hydrogen Balmer Equivalence Widths: Constrain the star’s effective surface temperature (\(T_{\text{eff}}\)), as the strength of these transitions maps the exact thermal kinetic energy required to populate the \(n=2\) atomic state without driving complete ionization.
2. Periodic Line Centroid Shifts: Unveil a variable radial velocity vector, providing direct mathematical evidence of a companion object—such as an exoplanet or a brown dwarf—exerting a gravitational pull around a mutual center of mass.
3. Symmetrical Profile Broadening: Quantifies the stellar rotation vector (\(v \sin i\)) through the integration of blue-shifted and red-shifted Doppler components across the rotating stellar hemispheres.
4. Transient Emission Flux: Signals sudden magnetohydrodynamic adjustments in the upper atmosphere, where magnetic reconnection loops release stored energy to heat the local plasma, driving spontaneous de-excitation emission.
Advancements in Spectroscopic Technology
High-Resolution Echelle Spectrographs
Space-Based Radiative Observatories
Multi-Wavelength Cross-Section Spectroscopy
- Infrared Channels: Probe the lowest-temperature boundaries (\(T \le 3{,}500\,\text{K}\)), mapping complex rotational-vibrational molecular transitions (\(\text{TiO}\), \(\text{CO}\), \(\text{H}_2\text{O}\)) and tracking the cold dust opacities of circumstellar accretion disks.
- Optical/Visible Channels: Probe the baseline photosphere (\(\tau \approx 2/3\)), capturing electronic transitions of neutral metals (\(\text{Fe I}\), \(\text{Na I}\)) and the primary hydrogen Balmer series to dictate effective surface temperatures and metallicities.
- Ultraviolet Channels: Track the magnetically heated chromosphere and transition region, capturing highly energized resonance lines (e.g., \(\text{Mg II}\) h and k lines, \(\text{C IV}\)) that reflect non-thermal acoustic energy dissipation.
- X-Ray Channels: Audit the ultra-hot, low-density coronal plasma (\(T \ge 10^6\,\text{K}\)), measuring high-energy thermal bremsstrahlung radiation and emission lines from highly stripped metal ions to profile magnetic reconnection events and coronal mass ejections.
Analytical Reflection: The Necessity of Multi-Wavelength Inversion
1. Kinematic Micro-Velocity Calibration: Measuring the tiny Doppler shifts induced by low-mass exoplanets requires extreme spectral resolution (\(R \ge 100{,}000\)) and highly stabilized ground-based spectrographs (like ESPRESSO). Space telescopes prioritize broad aperture collections and stability over echelle calibration mechanisms, making ground-based, vacuum-sealed hardware the optimal choice for precision radial velocity metrics.
2. Layered Thermodynamic Mapping: The infrared molecular features, ultraviolet lines, and X-ray flares arise from distinct gas layers with entirely different ionization states and temperatures. The infrared bands capture the cold, bound molecular chemistry of the lower photosphere, while the UV and X-ray channels capture the non-thermal, magnetically driven thermal inversions of the chromosphere and corona.
3. Bypassing Atmospheric Absorption Openings: Earth’s atmosphere is completely opaque to ultraviolet and X-ray wavelengths due to ozone and upper-atmospheric absorption, while also introducing heavy telluric absorption across infrared bands. Space-based deployment is mandatory to capture these high-energy and infrared flux channels, allowing physicists to connect the star’s low-temperature chemistry with its high-energy magnetic loops.
Why Study Stellar Atmospheres and Spectroscopy
Understanding Stellar Surface Properties
The stellar atmosphere operates as the ultimate radiative boundary interface where internal energy transport mechanisms decouple from local plasma opacities. Students mathematically solve the equations of state to discover how localized effective temperatures, atmospheric pressure profiles, and metal opacities dictate the continuum flux escaping the star. Mastering these boundary conditions forms the analytical framework required to characterize stellar parameters from raw electromagnetic signatures alone, supporting the precise taxonomy of active stars across cosmic distance scales.
Spectral Lines and Element Identification
Stellar spectroscopy exploits the micro-physics of bound-bound quantum electronic transitions to map the explicit chemical abundance indices (\([Fe/H]\)) of distant star systems. Students trace the physical mechanisms through which specialized atomic and molecular configurations carve discrete absorption and emission lines into the continuous spectrum, governed strictly by the Planck-Einstein relation (\(\Delta E = h\nu\)). This provides students with advanced competencies in remote sensing methodologies, enabling the chemical auditing of stars situated thousands of light-years away without direct physical sampling.
Doppler Effects and Stellar Motion
Measuring the kinematic velocity vectors of starlight relies on the Doppler modulation of spectral line centroids relative to their laboratory rest frames (\(\frac{\Delta \lambda}{\lambda_0} = \frac{v_r}{c}\)). Students apply these vector transformations to calculate the orbital elements of spectroscopic binary stars, evaluate equatorial rotational velocities via line profile broadening profiles, and discover low-mass extrasolar planets through high-precision radial velocity tracking. This domain demonstrates how dynamic fluid motion and center-of-mass orbital interactions are encoded into wave vectors.
Modeling Atmospheres and Radiation Transfer
Students investigate the complex equations of radiative transfer to simulate synthetic stellar spectra, evaluating how radiation fields interact with matter under local thermodynamic equilibrium (LTE) constraints. These multi-variable models integrate continuous opacity coefficients, collisional Stark broadening broadening tensors, limb darkening effects, and steep vertical temperature gradients. Developing these computational models deepens a student’s grasp of quantum light-matter scattering mechanics and equips them to invert observational data into rigorous physical records of stellar interiors.
Applications in Modern Astronomy
Stellar spectroscopy serves as the definitive tool for calculating cosmological distance ladders, mapping galactic chemical enrichment histories, and profiling macroscale stellar populations. By parsing high-resolution echelle spectra, students cultivate high-level competencies in statistical data inversion, multi-wavelength signal processing, and precision instrumentation engineering. These highly analytical capabilities are directly transferable across plasma physics, aerospace systems, optical engineering, and data science fields, empowering students to solve complex scientific challenges.
Glossary of Key Diagnostic & Spectroscopic Terms
- Stellar Atmosphere
- The stratified, optically thin outer envelope of a star where internal energy transport mechanisms decouple from local plasma opacities, embedding quantum atomic signatures into the escaping radiative flux.
- Photosphere
- The visible surface layer of a star defined as the boundary interface where the continuum optical depth drops to \(\tau_\lambda \approx 2/3\), facilitating the transition from an opaque plasma to isotropic radiative diffusion.
- Chromosphere
- A dynamic, low-density atmospheric layer situated above the photosphere characterized by a non-thermal positive temperature gradient (\(T \approx 4{,}200 \rightarrow 25{,}000\,\text{K}\)) driven by acoustic and Alfvén wave energy dissipation.
- Corona
- The outermost, highly extended envelope of ultra-low density plasma maintained at extreme temperatures (\(T \ge 10^6\,\text{K}\)) via magnetic reconnection heating, serving as the hydrodynamic acceleration zone for stellar winds.
- Spectrum
- The continuous or discrete distribution of electromagnetic radiation intensity mapped across monochromatic frequency or wavelength parameters, functioning as the primary diagnostic record of a star’s physical state.
- Spectral Line
- A localized intensity variance carved into a spectrum, dictated by the Planck-Einstein relation (\(\Delta E = h\nu\)), indicating discrete bound-bound electron orbital transitions within specialized atomic configurations.
- Absorption Line
- A narrow flux deficit generated within a continuous spectrum when an escaping radiation field passes through cooler atmospheric layers, driving bound-bound electronic excitations along the line of sight.
- Emission Line
- A sharp channel of localized radiative flux produced when low-density, highly energized gas undergoes spontaneous quantum de-excitation, projecting photons along specific line-of-sight paths.
- Doppler Shift
- The systematic migration of wave vector centroids (\(\frac{\Delta \lambda}{\lambda_0} = \frac{v_r}{c}\)) induced by a relative radial velocity vector between the emitting stellar framework and the observer.
- Zeeman Effect
- The quantum mechanical breaking of spatial energy state degeneracies in the presence of an external magnetic field (\(B\)), causing individual spectral lines to split into distinct, polarized sub-components (\(\Delta \lambda_Z \propto g_{\text{eff}} \lambda^2 B\)).
Academic & Observational Resources
Summary & Essential Module Invariants
Frequently Asked Questions: Radiative Transfer & Spectral Diagnostics
What is the formal physical definition of a stellar atmosphere?
What parameters are evaluated within the framework of stellar spectroscopy?
What quantum mechanical processes drive the formation of Fraunhofer absorption lines?
How do line profiles and equivalent widths yield quantitative data about a star’s structural state?
What physical gradients govern the Harvard spectral classification sequence?
By what mathematical relations do spectral line centroids reveal radial velocity and exoplanetary wobbles?
How do high-resolution spectrographs and computational models interact to process radiative data?
Why is mastering stellar spectroscopy vital for advanced university preparation in STEM paths?
Review Questions and Answers
- What are stellar atmospheres, and why are they important in astrophysics?Answer: A stellar atmosphere is the stratified, optically thin outer gas boundary layer of a star where internal energy transport mechanisms decouple from local plasma opacities (\(\tau_\lambda \le 2/3\)). They are structurally vital in astrophysics because they contain the quantum absorption and emission markers that allow researchers to calculate a star’s absolute effective surface temperature (\(T_{\text{eff}}\)), elemental abundance indices (\([\text{Fe}/\text{H}]\)), local surface gravity (\(\log g\)), fluid kinematics, and real-time magnetohydrodynamic dynamos.
- How does spectroscopy help determine the composition of a star?Answer: Spectroscopy utilizes dispersive optics to isolate continuous starlight into discrete monochromatic wavelengths. Quantized energy differences between bound atomic electron orbitals dictate that specific elements and ions absorb or emit photons at precise wavelengths matching the Planck-Einstein relation (\(\Delta E = h\nu\)). Identifying these specific line networks acts as a chemical fingerprint to determine absolute element presence and trace mass abundances within the atmosphere.
- What are the main layers of a stellar atmosphere?Answer: The primary functional zones are the photosphere, chromosphere, and corona. The photosphere is the visible boundary interface (\(\tau \approx 2/3\)) where the continuous blackbody continuum radiates into space. The chromosphere features a non-thermal positive temperature gradient (\(T \approx 4{,}200 \rightarrow 25{,}000\,\text{K}\)) driven by wave dissipation. The corona is the outermost, ultra-low density envelope containing highly ionized plasma heated past \(T \ge 10^6\,\text{K}\) by magnetic mechanisms, emitting strongly in ultraviolet and X-ray channels.
- How do absorption lines provide clues about a star’s temperature?Answer: The equivalent widths (\(W_\lambda\)) and profiles of absorption lines are fundamentally regulated by the temperature-dependent Saha-Boltzmann ionization balance. Thermal kinetic energies dictate the absolute fraction of atoms residing in specific excitation and ionization states. Consequently, measuring the relative line strengths of neutral versus ionized metal species calculates the absolute thermodynamic state grid of the photospheric plasma.
- What role do Doppler shifts play in stellar spectroscopy?Answer: The Doppler effect modulates the wave vectors of starlight whenever a non-zero radial velocity vector exists between the star and the observer. Measuring the systematic shifting of spectral line centroids relative to their laboratory rest frames via the relation \(\frac{\Delta \lambda}{\lambda_0} = \frac{v_r}{c}\) allows astrophysicists to compute absolute radial velocities, reconstruct spectroscopic binary orbits, profile equatorial rotation rates via symmetrical line broadening, and detect low-mass exoplanets.
- How do emission lines differ from absorption lines?Answer: Absorption lines manifest as localized flux deficits carved into a continuous blackbody spectrum when photons drive bound-bound electronic excitations within cooler gas layers along the observer’s line of sight. Emission lines manifest as narrow spikes of intense radiative flux generated when low-density, high-temperature plasma undergoes spontaneous quantum de-excitation. Both function as distinct tracers of the local thermodynamic conditions across different atmospheric altitudes.
- What information can spectral classification reveal about a star?Answer: A full Morgan-Keenan stellar classification code breaks physical degeneracies to locate a star’s coordinates on the H-R diagram. The Harvard spectral type sequence (\(O \rightarrow B \rightarrow A \rightarrow F \rightarrow G \rightarrow K \rightarrow M\)) defines the effective surface temperature metric based on atomic ionization balances. Concurrently, the Roman numeral luminosity class maps the local surface gravity (\(\log g\)) and absolute structural radius via pressure broadening line diagnostics.
- How does the analysis of spectral lines help us understand stellar dynamics?Answer: The geometric contours and wavelength shifts of spectral lines act as direct probes of macroscale and microscale fluid dynamics. Symmetrical profile broadening maps equatorial rotation velocities, asymmetric distortions trace convective overshooting and turbulence fields, periodic oscillations uncover structural acoustic wave propagation, and highly expanded blue-shifted absorption profiles (P-Cygni profiles) map the mass-loss velocities of stellar winds.
- How can the structure of a stellar atmosphere affect the observed spectrum?Answer: The steep vertical temperature, pressure, and density gradients across the atmospheric layers alter the localized optical depth (\(\tau_\lambda\)). Because different spectral frequencies decouple from the plasma at distinct optical depths, the aggregate spectrum emerges as a superimposed, multi-layered signal. Accurate spectral inversion requires solving complex equations of radiative transfer that model these stratified atmospheric zones under non-LTE conditions.
- How has spectroscopy advanced our understanding of stellar evolution?Answer: Spectroscopy provides the empirical confirmation needed to validate theoretical models of stellar evolution. By measuring how atmospheric metallicity indices, surface gravity signatures (\(\log g\)), and molecular line tracers shift across stellar populations, astronomers map how stars transition off the main sequence, expand into giants, activate advanced shell nucleosynthesis networks, shed mass envelopes, and compress into degenerate compact remnants.
Thought-Provoking Questions and Answers
- How might advancements in spectroscopy change our understanding of stellar atmospheres in the future?Answer: Next-generation high-resolution instruments calibrated by laser frequency combs will allow for the sub-cm/s tracking of spectral line profiles. This extreme precision will enable astronomers to map three-dimensional granular convection cells in real time, decode micro-turbulence tensors, and detect Earth-mass exoplanets around highly active hosts by separating stellar magnetic noise from pure gravitational center-of-mass displacements.
- What challenges exist in accurately modelling stellar atmospheres?Answer: Modeling stellar atmospheres requires solving non-linear, time-dependent magnetohydrodynamic (MHD) equations coupled with non-local thermodynamic equilibrium (non-LTE) radiative transfer. Simulating the three-dimensional interactions between turbulent convection, radiative diffusion, molecular opacities, and magnetic reconnection loops requires extreme computational grids and introduces significant modeling degeneracies where different parameter combinations produce identical synthetic spectra.
- How can stellar spectroscopy support the search for exoplanets?Answer: Spectroscopy drives two primary exoplanetary diagnostic paths: the radial velocity method tracks high-precision periodic Doppler displacements in photospheric absorption lines to calculate orbital profiles and mass boundaries (\(M \sin i\)). Concurrently, transit transmission spectroscopy measures the minute absorption markers carved into starlight as it filters through an exoplanet’s atmospheric limb, identifying volatile components such as \(\text{H}_2\text{O}\), \(\text{CO}_2\), and \(\text{CH}_4\).
- How do magnetic fields influence spectral lines in stellar atmospheres?Answer: Magnetic fields split degenerate atomic energy states into multiple polarized sub-components through the Zeeman effect, with the line separation scaling as \(\Delta \lambda_Z \propto g_{\text{eff}} \lambda^2 B\). Beyond breaking quantum degeneracy, magnetic fields alter the vertical thermal profile, generating cool, low-flux starspots that introduce line profile asymmetries and driving mechanical energy dissipation that ignites high-energy chromospheric and coronal emissions.
- How can high-resolution spectroscopy help us study stellar variability?Answer: High-resolution spectroscopy (\(R \ge 100{,}000\)) resolves time-variable line profile distortions that reveal structural oscillations. By tracking periodic variations in equivalent widths and mapping Doppler velocity displacements across specific line wings, asteroseismology transforms surface variations into direct measurements of internal density gradients, core rotation rates, and convective boundary reconfigurations.
- What limitations might prevent current spectroscopic methods from fully explaining stellar atmospheres?Answer: Primary observational boundaries include telluric molecular contamination from Earth’s atmosphere, finite signal-to-noise ratios in distant faint objects, and incomplete subatomic data regarding high-excitation transition cross-sections. Furthermore, simplifying multi-dimensional turbulent shocks into one-dimensional local thermodynamic equilibrium codes introduces systemic errors when calculating absolute elemental abundances.
- How can multi-wavelength spectroscopy provide a more complete view of stellar atmospheres?Answer: Multi-wavelength analysis breaks the optical depth degeneracies of single-band modeling by isolating different atmospheric layers. Infrared bands isolate low-temperature molecular chemistry (\(T \le 3500\,\text{K}\)); visible bands profile the baseline photosphere (\(\tau \approx 2/3\)); ultraviolet channels capture non-thermal chromospheric wave heating; and X-ray spectrographs record high-energy coronal bremsstrahlung loops, mapping the entire energy flux pathway.
- How might new telescopes and space missions improve stellar spectroscopy?Answer: Next-generation space observatories eliminate telluric atmospheric absorption and wavefront distortions. Deploying large-aperture space spectrographs provides the raw photon collection limits and sub-angstrom clarity required to isolate the spectra of pristine Population III stars, map the atmospheres of small habitable exoplanets, and test extreme gravitational redshifts near compact stellar remnants.
- What role does the interaction between radiation and matter play in shaping spectral features?Answer: The interaction between the radiation field and local plasma opacities determines the structural energy balance of the star. Radiative transfer governs the excitation and ionization state populations by continuous photon absorption, electron scattering, and spontaneous decay. The resulting line profiles (wings and core depths) map the exact cross-section competition between radiative scattering opacities and local gas pressures.
- Can unusual spectral features lead to new discoveries?Answer: Anomalous line equivalent widths, unexpected ionization states, or extreme line profile asymmetries often signal missing physical mechanisms. Historically, unexplained spectral lines led to the discovery of helium, revealed extreme elemental enrichment via the s-process, exposed the ultra-dense physics of electron-degenerate matter in white dwarfs, and proved the existence of powerful stellar winds.
- How does the study of spectral lines help us understand stellar winds and mass loss?Answer: High-velocity mass ejections generate diagnostic P-Cygni profiles, which feature a blue-shifted absorption trench superimposed on a broad, symmetrical emission peak. The blue-shifted component is carved by material expanding directly toward the observer, while the emission peak captures the isotropic decay of the surrounding circumstellar envelope. Modeling these profiles calculates absolute wind terminal velocities and mass-loss rates (\(dM/dt\)).
- How does spectroscopy of stellar atmospheres affect the wider field of astrophysics?Answer: Stellar spectroscopy serves as the definitive empirical foundation for the broader universe. Calibrating photospheric metal abundances provides the chemical indices required to track galactic enrichment history, profiling cluster turn-off points anchors cosmological age metrics, and analyzing the absorption signatures of distant Cepheid variables fixes the cosmic distance ladders that constrain the expansion rate of the universe.
Numerical Problems and Solutions: Wave Mechanics, Photonics, and Doppler Kinematics
- Problem: An optical sensor registers a photospheric emission wave vector at a monochromatic wavelength of exactly \(\lambda = 5.0 \times 10^{-7}\,\text{m}\). Calculate the exact oscillation frequency (\(f\)) of the escaping radiation field, assuming a vacuum speed of light constant \(c = 3.0 \times 10^8\,\text{m/s}\).Solution: Rearrange the fundamental electromagnetic wave propagation relation to isolate the frequency parameter:\[f = \frac{c}{\lambda} = \frac{3.0 \times 10^8\,\text{m/s}}{5.0 \times 10^{-7}\,\text{m}}\] \[f = 6.0 \times 10^{14}\,\text{Hz}\]
Answer: The oscillation frequency of the localized radiation field equals \(f = 6.0 \times 10^{14}\,\text{Hz}\) (or \(600\,\text{THz}\)). - Problem: Determine the discrete energy quantum (\(E\)) in Joules carried by an individual photon oscillating at a frequency of \(f = 6.0 \times 10^{14}\,\text{Hz}\) within a stellar atmosphere, using Planck's constant \(h = 6.63 \times 10^{-34}\,\text{J}\cdot\text{s}\).Solution: Substitute the frequency vector directly into the Planck-Einstein energy equation:\[E = hf = (6.63 \times 10^{-34}\,\text{J}\cdot\text{s})(6.0 \times 10^{14}\,\text{s}^{-1})\] \[E = 3.978 \times 10^{-19}\,\text{J}\]
Answer: The localized energy packet transported by the photon equals \(E \approx 3.98 \times 10^{-19}\,\text{J}\) (approximately \(2.48\,\text{eV}\)). - Problem: Calibrate the continuous thermal profile of a solar-type stellar photosphere operating at an effective surface temperature of \(T = 6000\,\text{K}\). Calculate its peak spectral monochromatic wavelength (\(\lambda_{\text{max}}\)) in meters by applying Wien's displacement theorem, using the constant \(b = 2.9 \times 10^{-3}\,\text{m}\cdot\text{K}\).Solution: Isolate the maximum wavelength parameter using Wien's proportionality relation:\[\lambda_{\text{max}} = \frac{b}{T} = \frac{2.9 \times 10^{-3}\,\text{m}\cdot\text{K}}{6000\,\text{K}}\] \[\lambda_{\text{max}} \approx 4.8333 \times 10^{-7}\,\text{m}\]
Answer: The thermal continuum exhibits its peak radiative energy density at \(\lambda_{\text{max}} \approx 4.83 \times 10^{-7}\,\text{m}\) (or \(483\,\text{nm}\)), anchoring it within the blue-green visible spectrum. - Problem: A high-resolution echelle spectrograph registers a prominent hydrogen absorption line centroid shifted to an observed wavelength of \(\lambda = 656\,\text{nm}\), whereas laboratory vacuum metrics fix the rest frame transition at exactly \(\lambda_0 = 650\,\text{nm}\). Compute the absolute radial velocity vector (\(v_r\)) of the star using the linear Doppler velocity equation.Solution: First, isolate the net rest-frame wavelength displacement (\(\Delta \lambda\)):\[\Delta \lambda = \lambda - \lambda_0 = 656\,\text{nm} - 650\,\text{nm} = 6\,\text{nm}\]Next, apply the linear Doppler transformation relation to solve for the velocity component:\[v_r = c \cdot \frac{\Delta \lambda}{\lambda_0} = (3.0 \times 10^8\,\text{m/s}) \cdot \left(\frac{6\,\text{nm}}{650\,\text{nm}}\right)\] \[v_r \approx (3.0 \times 10^8) \cdot (0.00923077) \approx 2.7692 \times 10^6\,\text{m/s}\]
Answer: The star exhibits a positive radial velocity vector (recession) of \(v_r \approx 2.77 \times 10^6\,\text{m/s}\) (or \(2770\,\text{km/s}\)). - Problem: If a localized gravitational contraction increases a star's effective surface temperature (\(T\)) during post-main-sequence reconfigurations, analyze the resulting physical adjustments imposed on its peak continuum wavelength profile (\(\lambda_{\text{max}}\)).Solution: According to Wien's displacement relation (\(\lambda_{\text{max}} T = b\)), an inverse mathematical coupling links a blackbody's absolute thermal baseline to its wavelength emission peak. As temperature spikes, the continuous energy density distribution shifts toward elevated frequency thresholds, driving the peak wavelength down into shorter bounds.
Answer: The peak wavelength decreases monotonically, shifting the star's continuum color toward higher-energy blue or ultraviolet channels. - Problem: An ultraviolet resonance transition line within the upper chromosphere features a localized oscillation frequency of exactly \(f = 1.0 \times 10^{15}\,\text{Hz}\). Calculate its corresponding spatial wavelength (\(\lambda\)) in meters.Solution: Invert the wave velocity equation to calculate the spatial metric directly:\[\lambda = \frac{c}{f} = \frac{3.0 \times 10^8\,\text{m/s}}{1.0 \times 10^{15}\,\text{Hz}}\]
Answer: The spatial wavelength of the chromospheric line equals \(\lambda = 3.0 \times 10^{-7}\,\text{m}\) (or exactly \(300\,\text{nm}\)). - Problem: An astronomical absorption line transition absorbs a discrete photon packet holding exactly \(E = 4.0 \times 10^{-19}\,\text{J}\) of energy. Calculate the exact quantum oscillation frequency (\(f\)) required to satisfy this energy barrier using Planck's constant \(h = 6.63 \times 10^{-34}\,\text{J}\cdot\text{s}\).Solution: Isolate the frequency variable by rearranging the Planck-Einstein quantization law:\[f = \frac{E}{h} = \frac{4.0 \times 10^{-19}\,\text{J}}{6.63 \times 10^{-34}\,\text{J}\cdot\text{s}}\] \[f \approx 6.0331 \times 10^{14}\,\text{Hz}\]
Answer: The quantum oscillation frequency tracking the electron orbital transition equals \(f \approx 6.03 \times 10^{14}\,\text{Hz}\). - Problem: Formulate the micro-physical explanation for why discrete dark Fraunhofer lines embedded within an unresolved starlight profile allow for the direct identification of a star's elemental composition across cosmic distances.Solution: Every unique atomic and ionic species possesses a highly specialized arrangement of quantized electronic orbitals. Bound transitions between these orbitals demand the absorption of a photon carrying an exact energy value (\(\Delta E = h\nu\)) that matches the energy difference between those specific shells. Because these energy configurations are unique to each element, the resulting line frequencies act as direct physical evidence of the elements present.
Answer: Electronic orbital configurations are element-specific; mapping the line frequencies identifies the atomic fingerprints of the absorbing species. - Problem: If a target stellar structure possesses a high-velocity kinematic vector oriented directly toward the terrestrial observer, deduce the resulting geometric modifications imposed on its photospheric absorption line centroids.Solution: An approaching system generates a negative radial velocity vector relative to the observer. According to the Doppler shifting mechanics (\(\frac{\Delta \lambda}{\lambda_0} = \frac{-v_r}{c}\)), this spatial velocity vector compresses the incoming wave trains, causing a systemic reduction in the observed wavelengths (\(\lambda < \lambda_0\)).
Answer: The line centroids undergo a systematic shift toward shorter, higher-frequency paths, generating a measurable blueshift signature.