Economics is the art and science of choice. It asks how we can best use what little we have—time, money, energy, land—to meet our endless desires and dreams. This discipline doesn’t just sit in textbooks; it plays out in every household budget, every government policy, every shop shelf and market stall. At its core, economics helps us understand how decisions are made when scarcity rules the game.
It influences the big picture and the personal one. When a nation adjusts its interest rates or a parent decides between groceries and school supplies, both are navigating economic terrain. Through Macroeconomics, we zoom out to explore inflation, unemployment, and national income. Through Microeconomics, we zoom in to understand pricing, consumer choices, and how companies compete. Each view adds depth to how we see the world.
The fingerprints of economics are everywhere—especially in careers built around money, planning, and market strategy. In Finance, economics helps us weigh risk and return. In Accounting, it guides how we track and manage value. And in Marketing, it reveals what drives people to buy, compare, and choose. These fields rely on clear economic thinking to make wise, forward-looking decisions.
Today’s economists work with tools that sharpen their vision. Data Analysis and Statistics are no longer optional—they are essential lenses to see tomorrow’s trends today. Yet numbers don’t tell the full story. History breathes life into data, revealing the roots of today’s economic systems. The study of Economic History and Financial History connects our present decisions to the echoes of past crises, innovations, and reforms.
Economics is not only about markets. It’s also about rules—about what’s fair, who’s accountable, and how systems function. That’s where law and governance enter the picture. In Corporate Governance, the focus is on ethics and accountability within businesses. Corporate Law defines legal structures that shape business decisions. And Compliance and Regulatory Adherence ensures organizations play by the rules. These areas reveal the deep, quiet structure behind the bustle of commerce.
But economics also soars beyond borders. In Trade and Globalization, we discover how goods, ideas, and services flow between nations. International Business shows how companies grow, merge, and adapt across cultures and continents. And when disputes arise, Conflict Resolution and Arbitration helps resolve them through negotiation, not war. In each domain, economics acts like a compass for global cooperation.
Technology has become economics’ newest frontier. Algorithms are now analyzing markets faster than any human mind. Artificial Intelligence and Machine Learning, once futuristic ideas, now drive business decisions in real time. Deep Machine Learning allows us to predict customer behavior or supply shortages with astonishing accuracy. Expert Systems turn complex economic rules into automated recommendations. The digital revolution doesn’t just speed up economics—it rewrites it.
With innovation comes responsibility. Economic policy must adapt, anticipate, and stay fair. This is the realm of Policy Analysis, where leaders weigh consequences before acting. Taxation and Fiscal Policy guides how governments raise and spend money wisely. Budgeting and Cost Management helps ensure that projects deliver value and accountability. These areas turn economic theory into public impact.
Economics also speaks to our collective good. It shapes how we fund schools, train teachers, and design learning paths. In Education and Curriculum Design, economic thinking asks: how can we teach more, reach more, and waste less? In Strategic Management, it aligns long-term goals with real-world limits. These practices turn abstract numbers into improved lives.
As we look back and forward, economics remains a bridge between ideals and action. The early philosophers of Economic Thoughts and Theory asked deep questions about justice, labor, and power. Today, we channel that legacy through data and technology. Business Analytics now helps leaders navigate uncertainty with confidence. And still, the heart of economics beats in the same place: a deep desire to understand how we live, what we value, and how we can make better choices—for ourselves and for others.
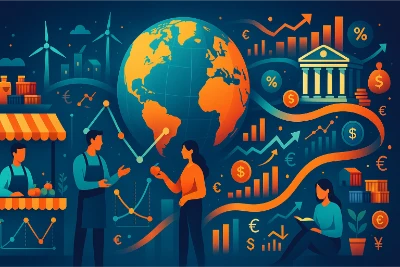
A vibrant, isometric-style scene visualizes the core ideas of economics. A globe with trade routes anchors the composition, surrounded by rising and falling bar and line charts, supply-and-demand curves, and currency symbols. On one side, a factory, wind turbines, and shipping containers represent production, energy and international trade; on the other, a small shop, farmers and consumers highlight everyday market activity. Arrows signal cycles of growth and contraction, while a bank building and scales of justice hint at finance and policy. Together these elements portray how microeconomic decisions and macroeconomic forces interact to shape prices, jobs, output and global prosperity.
Economics: The Study of Resources, Choices, and Society
Economics is not just about money or markets—it’s about life itself. It is the study of how we make choices when there simply isn’t enough to go around. From the air we breathe to the food on our tables, from job markets to climate action, the principles of economics shape every corner of our daily existence. This social science is rooted in a simple yet powerful idea: resources are limited, but our desires are not. And in that tension lies a story worth understanding.
At its heart, economics asks: How do individuals, businesses, and governments decide what to do with their time, money, energy, and talents? The answers lie in the careful balancing act between needs and wants, scarcity and abundance, efficiency and fairness. By studying economics, we learn to see the invisible threads that bind people and systems together—how the price of coffee is connected to rainfall in Brazil, or how a new factory opening in one town ripples into wages and costs in another.
This discipline brings clarity to chaos. Through the lens of economics, decision-making becomes a map of motivations, constraints, and possible futures. It decodes the logic behind consumer behavior, explains why firms compete or collaborate, and helps us understand how policies like taxes or subsidies affect everyday choices. Supply and demand are not just curves on a graph—they are living forces shaping real-world actions, influencing what we buy, how we work, and what we value.
Zooming in, economics reveals the dynamics of individual decision-making. It explores why one family saves while another borrows, or why a student chooses to pursue one degree over another. These are the micro-level puzzles that speak to our hopes, risks, and trade-offs. Meanwhile, at the macro level, economics captures the big picture—how whole economies grow or shrink, why inflation rises, or how global trade links distant nations into a shared rhythm of exchange.
Economics is also the compass for navigating complex problems. Questions like “How can we reduce poverty?” or “What’s the fairest way to tax citizens?” require careful reasoning grounded in economic thinking. It’s a discipline that equips us not with answers, but with the tools to ask better questions. It empowers us to see multiple perspectives and weigh competing priorities—an essential skill in a world full of limited time, money, and resources.
Its power is most visible in the policy arena. Governments rely on economic insights to craft strategies for stability and growth. Whether it’s managing unemployment, setting interest rates, or responding to inflation, every decision made by a central bank or treasury department rests on economic analysis. In this way, economics becomes a silent partner in shaping society, guiding the hand that governs without always being seen.
In the business world, economics fuels smart strategy and long-term vision. Companies use economic models to forecast demand, optimize pricing, and allocate capital. Investors use economic indicators to assess risk and reward. And entrepreneurs lean on economic intuition to find gaps in the market, reduce waste, and generate value. These decisions—though grounded in numbers—reflect deeper truths about human behavior and motivation.
Even at the personal level, economics plays a quiet but profound role. When we budget for groceries, choose a career, or invest in education, we’re engaging in economic behavior. Understanding this helps us become more thoughtful decision-makers. It reminds us that behind every number is a story—of priorities, trade-offs, and aspirations.
As the world faces urgent challenges—climate change, inequality, pandemics, automation—economics becomes more relevant than ever. It gives us frameworks to assess sustainability, equity, and resilience. It teaches us how to evaluate policy impacts, measure social progress, and balance short-term needs with long-term goals. In this way, economics is not just a subject in school—it’s a mindset for navigating the future.
Ultimately, economics connects us. It shows how individual choices ripple outward, influencing communities, nations, and the planet. It reveals that no decision is made in isolation and that every action—however small—takes place within a web of interdependence. To study economics is to study ourselves: our hopes, our limitations, and the creative ways we seek to thrive despite them.
The Living Tapestry of Economics and Its Far-Reaching Currents
Economics, at its heart, is the study of how we choose. In a world where resources are limited but human desires are infinite, it asks a simple yet profound question: how do we allocate what we have to fulfill what we need? This journey begins with the recognition of scarcity and leads to the intricate dance of decisions that individuals, families, businesses, and nations make every day. It’s not just about numbers and graphs—it’s about lives, livelihoods, priorities, and dreams.
To navigate this landscape, economics draws upon four essential pillars: land, which provides the physical space and natural resources; labor, the human effort that transforms raw materials into value; capital, the tools and infrastructure we build; and entrepreneurship, the spark of initiative that drives innovation and change. These forces converge in markets, factories, governments, and households—shaping the way we live and interact.
The discipline is divided into two broad streams. Microeconomics zooms in on the world of individual actors. It studies the decisions made by consumers who weigh satisfaction against price, by businesses that decide how much to produce and what to charge, and by workers who choose how and where to offer their labor. These decisions unfold within markets, where supply meets demand, and prices emerge as silent yet powerful communicators of value and scarcity. Microeconomics also explores market failures, such as monopolies or pollution, and examines the role of government in correcting these imbalances.
Macroeconomics, in contrast, takes a broader view. It steps back to observe the economy as a whole, analyzing trends and patterns that stretch across entire nations or the global stage. Macroeconomists ask big questions: What causes inflation to rise? Why does unemployment persist? How can a country stimulate growth without igniting instability? These questions are not academic alone—they shape real-world policies that affect millions. From interest rate decisions by central banks to stimulus packages during crises, macroeconomics provides the compass for national economic health.
Beyond theory, economics is a toolkit for real-world decision-making. It includes the use of models to simulate outcomes, statistical techniques to measure performance, and policy analysis to assess the likely impact of proposed regulations or reforms. Governments use these tools to design tax systems, manage budgets, and steer the economy toward stable and inclusive growth. Businesses apply them to forecast demand, optimize production, and respond to shifting market conditions.
The reach of economics extends into the fabric of everyday life. When a student chooses between taking a part-time job or studying full-time, she is engaging in economic reasoning. When a city debates investing in public transportation or expanding highways, economics helps weigh long-term benefits against short-term costs. And when nations negotiate trade agreements or climate targets, economic models help predict consequences and guide compromise.
Economics also serves as a bridge between disciplines. It overlaps with Statistics and Data Analysis, enabling researchers to make informed decisions based on evidence rather than intuition. It intersects with Corporate Law and Regulatory Compliance, ensuring fair practices and ethical conduct in the business world. It even informs Education and Curriculum Design, guiding resource allocation in schools and universities.
In today’s digitized world, economics must also grapple with new frontiers. Fields like Artificial Intelligence and Machine Learning are altering labor markets and business models. Decisions that once relied on human instinct are now supported—or replaced—by algorithms. Meanwhile, the emergence of the gig economy, cryptocurrency, and digital platforms calls for updated economic models that capture the fluidity of modern work and value exchange.
Furthermore, global challenges such as climate change, pandemics, and inequality demand economic thinking with a conscience. Economics must balance growth with sustainability, efficiency with equity, and innovation with resilience. It invites us not only to ask “What works?” but also “What matters?” and “For whom?”
Ultimately, to study economics is to learn how to listen to the silent language of choices—how to recognize the patterns that underlie prosperity and hardship, how to challenge assumptions, and how to envision a more thoughtful distribution of wealth and opportunity. It equips students with analytical rigor, ethical perspective, and the imaginative flexibility to see beyond immediate gains toward long-term well-being.
In essence, economics is not just a science of efficiency—it is a philosophy of possibility. It reminds us that every dollar spent, every law passed, every career chosen is part of a grand and complex mosaic of human intent. And by studying that mosaic, we gain not only knowledge but the power to shape a better world.
Economics in Action: How Ideas Shape Real-World Decisions
1. Forecasting Economic Trends
- Purpose and Power:
At the heart of forecasting lies the economist’s role as a visionary navigator. By using historical patterns, advanced models, and statistical tools, economists attempt to foresee the shifting tides of the economy. These forecasts help stakeholders prepare for change—whether it’s a spike in inflation, a downturn in consumer confidence, or a global crisis rippling through markets. With clearer foresight, firms and nations gain a strategic edge, turning uncertainty into calculated possibility. - Practical Applications:
- Anticipating how consumer spending might rise or fall during specific seasons to shape supply chain decisions.
- Analyzing demographic shifts and their potential impact on housing demand or education services.
- Projecting inflation rates to guide salary negotiations and pricing models in both public and private sectors.
- Predicting technological disruptions that might alter industry growth rates or create entirely new economic sectors.
- Illustrative Examples:
- A retail chain increasing winter stock based on projected consumer demand derived from past economic cycles.
- A government agency allocating emergency funds in anticipation of a recession signaled by falling manufacturing indices.
- Financial institutions adjusting mortgage interest rates in line with predicted monetary tightening by central banks.
- City planners timing infrastructure projects based on growth forecasts to prevent bottlenecks in transportation or utilities.
2. Guiding Business Strategies and Investments
- Purpose and Insight:
Every business decision, from launching a product to entering a new market, carries risk. Economics equips decision-makers with the tools to minimize that risk by understanding trends, customer behavior, resource costs, and macroeconomic signals. It’s not just about numbers—it’s about reading the story the economy is telling and aligning strategy accordingly. When companies listen well, they innovate wisely and grow sustainably. - Practical Applications:
- Pinpointing emerging economies with rising middle-class demand as fertile ground for expansion.
- Using exchange rate forecasts to time international acquisitions or exports.
- Aligning production scale with predicted changes in commodity prices or labor availability.
- Crafting resilient supply chains by mapping economic risks in partner countries.
- Illustrative Examples:
- A solar panel manufacturer increasing output after identifying policy trends favoring green technology investment.
- A digital startup choosing to delay an IPO during a predicted market downturn.
- A logistics company shifting operations closer to consumers based on economic migration data and fuel cost projections.
- Retail investors rebalancing portfolios based on macroeconomic signals like interest rate hikes or GDP contractions.
3. Designing Public Policies
- Purpose and Vision:
Public policy without economic grounding is like a ship without a compass. Whether targeting poverty, climate change, or joblessness, effective policies require deep understanding of economic cause and effect. Economics turns abstract ideals into measurable action plans. It ensures that well-meaning interventions do not backfire and that scarce public funds are deployed for maximum benefit. When governments get it right, they don’t just fix problems—they create conditions for long-term societal flourishing. - Practical Applications:
- Evaluating the likely outcomes of raising minimum wage in different industries and regions.
- Designing healthcare subsidies that balance affordability with fiscal sustainability.
- Modeling the environmental and economic impacts of carbon taxes to steer industries toward greener practices.
- Analyzing the ripple effects of free trade agreements on local manufacturing and employment rates.
- Illustrative Examples:
- Introducing child tax credits to reduce poverty while stimulating family-centered spending.
- Restructuring social security systems in aging societies to ensure generational equity.
- Using dynamic scoring to estimate how a change in tax policy might impact national revenue and investment behavior.
- Creating stimulus programs during pandemics or recessions that both preserve jobs and lay groundwork for recovery.
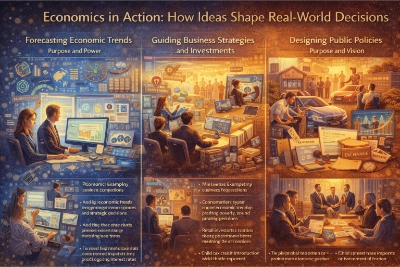
A structured, three-column infographic that illustrates how economic ideas translate into real-world decisions. The first panel focuses on forecasting, depicting analysts using charts, models, and historical data to anticipate inflation, demand shifts, and market cycles. The second panel shows business strategy and investment planning, with teams interpreting market signals, prices, and risk indicators to time expansion, production, and financing choices. The third panel highlights public policy design, portraying decision-makers weighing trade-offs and using economic evidence to craft measures such as tax credits, subsidies, stimulus programs, and climate-related policies. The overall scene emphasizes economics as a practical toolkit for navigating uncertainty and making informed decisions.
Real-World Journeys Shaped by Economic Thinking
1. Demand and Supply Analysis
- Scenario:
A manufacturing company prepares to launch a sleek, eco-friendly appliance. Before setting the price, the firm turns to demand and supply analysis. Through detailed research, they explore consumer preferences, competitor pricing, and anticipated material costs. They graph supply and demand curves, study market elasticity, and model different price points to understand how consumers might respond. - Outcome:
Instead of relying on instinct or tradition, the firm chooses a price grounded in data and logic. The result is remarkable—sales take off, margins are healthy, and inventory turnover aligns with projections. Because the price reflects real-world behavior, the company avoids overproduction or waste. Competitors scramble to adjust, but the firm’s foresight gives it a lasting edge. Not only does it earn more—it builds a reputation for responsiveness and savvy strategy. - Additional Reflections:
This case reminds us that behind every successful product is not just a great design but a story of intelligent pricing. When businesses listen closely to what the market whispers—through data, trends, and signals—they can translate uncertainty into success. The invisible hand of the market becomes a guide, not a mystery.
2. Trade Policy Evaluation
- Scenario:
A regional government is weighing whether to join a new trade pact. Economists are tasked with evaluating how reduced tariffs, harmonized regulations, and broader market access will influence domestic industries. They analyze sector-by-sector gains and losses, project the long-term impact on GDP, and assess how the agreement might reshape the labor market and supply chains. - Outcome:
The analysis uncovers surprising insights: while a few industries may face short-term competition, the broader economy stands to benefit from export growth, lower consumer prices, and more diverse supply networks. Based on this evidence, the trade agreement is signed. Within a few years, export volumes rise dramatically. Small manufacturers access new customers abroad. Job creation spreads through port cities and logistics hubs. Even foreign relations improve as economic ties deepen mutual understanding. - Additional Reflections:
Trade, often debated with emotion, is here illuminated by economics. It shows us that cooperation, when built on analysis and foresight, can yield dividends beyond profit—strengthening diplomacy, spurring innovation, and connecting lives across borders. Economic analysis becomes a bridge between policy and peace.
3. Economic Impact of Fiscal Policies
- Scenario:
A nation stumbles into recession. Businesses close, unemployment climbs, and consumer confidence plummets. The government must act quickly—but wisely. Drawing on economic theory, it implements a mix of fiscal tools: tax relief for families, direct support for struggling businesses, and infrastructure investment to create jobs. The aim? To awaken demand, reignite production, and prevent long-term decline. - Outcome:
Within months, early indicators brighten. Retail sales rebound. Construction cranes return to skylines. Families with more disposable income begin to spend, and businesses cautiously hire again. Though challenges remain, the fiscal stimulus cushions the blow and sets a path toward recovery. Economic metrics improve, but more importantly, hope returns to daily life—through paychecks, new projects, and bustling main streets. - Additional Reflections:
This example shows how policy grounded in economic wisdom can do more than crunch numbers—it can ease suffering and rebuild confidence. When guided by evidence and empathy, governments can transform tools like taxation and spending into instruments of healing. Economics becomes not just a science of wealth, but a language of renewal.
New Directions Shaping the Future of Economics
Behavioral Economics
- In the past, many economic theories assumed that humans always make rational choices—like perfect calculators of risk, reward, and cost. But life has shown us otherwise. People procrastinate, follow crowds, chase losses, and ignore logic. Behavioral economics steps in to bridge that gap between theory and reality. It explores how emotions, habits, and cognitive biases influence economic decisions.
- From why we overspend during sales to why people save less than they should, behavioral economics helps explain these everyday puzzles. Governments use these insights to design better policies—like “nudging” people to save for retirement by making it the default option. Businesses use it to build customer loyalty or reduce cart abandonment. It’s not just economics with a human touch—it’s economics that listens to our inner dialogue.
- This field invites economists to be part psychologist, part storyteller, and part detective—seeking out the unseen forces that shape our financial lives. As we continue to understand ourselves more deeply, so too does economics evolve from a cold science of numbers into a warm mirror of human nature.
Sustainability and Environmental Economics
- Economics is no longer just about profit margins and GDP growth. Today, it must ask: at what cost to the Earth? Environmental economics blends economic logic with ecological wisdom. It studies how policies, incentives, and markets can help preserve our planet while supporting development. It weighs the value of clean air, protected forests, and reduced carbon emissions—not just as ideals, but as essential resources.
- Carbon pricing, green subsidies, and pollution taxes are tools born of this branch. They signal to industries and consumers that environmental care carries economic weight. When done thoughtfully, these policies steer economies toward sustainability without sacrificing innovation or livelihoods. The goal is not to slow progress but to reshape its path—so future generations can inherit both wealth and wonder.
- In this age of climate urgency, sustainability economics offers hope. It calls on leaders, citizens, and businesses to act with foresight. To imagine cities powered by renewables, economies built on circular systems, and prosperity that does not deplete but replenishes. It’s a discipline where numbers grow green roots.
Digital and Data Economics
- The digital age has rewritten the rules of value, trade, and labor. Data, once ignored, is now called the “new oil.” Algorithms decide prices. Cryptocurrencies challenge traditional money. Artificial Intelligence forecasts markets in milliseconds. In this whirlwind, digital economics examines how technology reshapes economic activity at every level.
- Economists now study how data is monetized, how online platforms create “winner-takes-all” markets, and how privacy becomes a bargaining chip. The rise of gig work, online banking, and e-commerce also bring new patterns—fluid, fast-paced, and borderless. Inflation might behave differently in digital marketplaces. Labor may need new protections. Central banks now explore digital currencies to stay relevant.
- Digital economics doesn’t just observe these changes—it equips us to navigate them. It teaches tomorrow’s leaders to think critically about ethics in AI, fairness in algorithmic pricing, and the meaning of currency in a world without cash. Here, economics becomes a compass for the future.
Globalization and Trade Dynamics
- The modern world hums with global movement—of goods, services, people, and ideas. A mobile part made in Malaysia powers a car assembled in Germany and sold in Brazil. A sudden policy shift in one country sends ripples across oceans. Understanding this complex web is the heart of globalization economics.
- Economists study how open borders impact job markets, how trade agreements shift regional power, and how supply chains balance cost with resilience. They weigh the benefits of comparative advantage against the vulnerabilities of dependence. They also explore how technology and transport continue to shrink time and distance between nations.
- But this field also brings new tensions. How do we protect local workers while embracing global opportunities? How do we manage trade-offs between efficiency and security? Economists must now think like diplomats, engineers, and historians all at once.
- In this arena, economics becomes a dialogue—between nations, between values, and between generations. The challenge is not just to trade more, but to trade wisely, fairly, and with resilience in mind.
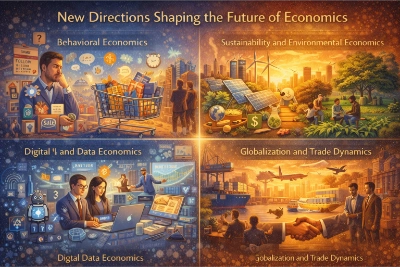
A quadrant-style illustration mapping four emerging fields reshaping modern economics. The Behavioral Economics panel uses everyday consumer scenes and decision cues to show how biases and emotions influence choices. The Sustainability and Environmental Economics panel features solar panels, wind turbines, green landscapes, and policy symbols to represent climate-focused incentives and circular growth. The Digital and Data Economics panel depicts analysts working with AI, dashboards, and online platforms to convey data as a core economic asset. The Globalization and Trade Dynamics panel shows ports, ships, planes, supply chains, and international partnership imagery, highlighting interconnected markets and cross-border flows of goods and ideas.
Ongoing Dilemmas in Modern Economic Practice
Forecasting Uncertainty in a Shifting World
- Economists strive to see ahead, to glimpse what the future holds. They build models, study patterns, and track data streams. Yet the world has grown more unpredictable. A pandemic can pause global commerce overnight. A single war can send oil prices soaring across continents. In these moments, even the best forecasts falter.
- The challenge isn’t just about data—it’s about the unknown. Economists must now blend science with intuition, logic with humility. They must learn to include “black swan” events—rare but powerful disruptions—into their models. This means embracing uncertainty, not just minimizing it.
- To plan for tomorrow, businesses and governments still need guidance. But instead of one fixed path, economists must provide flexible scenarios, helping decision-makers adapt as conditions change. Economics becomes not a crystal ball, but a compass in fog.
The Tightrope Between Growth and Sustainability
- For decades, growth was king. More production, more trade, more wealth—these were the signs of success. But today, the Earth’s voice grows louder. Forests disappear. Oceans rise. Inequality deepens. The pursuit of endless growth, without reflection, begins to fray at its edges.
- The new question is: how do we grow wisely? Can we boost GDP without draining rivers? Can we create jobs without exhausting the soil? This is the great balancing act of our time. Economists now work alongside ecologists, engineers, and activists to find harmony between markets and nature.
- Green investments, circular economies, and sustainable finance are emerging as bridges. They connect profit with preservation. In this new vision, success means more than numbers. It means leaving the world richer—not just in goods, but in goodness.
Confronting Inequality in All Its Forms
- In every nation, shadows of inequality stretch across the land. Some neighborhoods flourish; others struggle. Some children have libraries and mentors, while others face hunger and silence. The divide is not only in income, but in opportunity, dignity, and hope.
- Economists measure these gaps and trace their roots—historical, structural, systemic. But numbers are not enough. Solutions require empathy, imagination, and courage. Progressive tax reforms, social safety nets, and inclusive education policies are part of the answer. So are community-led initiatives and policies tailored to local needs.
- Bridging these gaps is not just moral—it’s practical. Economies thrive when everyone has a chance to contribute and flourish. True prosperity cannot exist alongside deep, persistent poverty. The task is immense, but the reward is a more just and vibrant society.
Keeping Pace with Rapid Technological Change
- The digital revolution moves at lightning speed. New technologies—artificial intelligence, robotics, blockchain—redraw the economic map. Old industries fade. New ones rise. Labor markets are jolted. Skills that were prized yesterday may be obsolete tomorrow.
- Automation, AI, and digital transformation bring both promise and peril. They raise productivity and open doors to innovation. But they also displace workers, deepen digital divides, and challenge old regulatory frameworks.
- Economists now face the task of rethinking education, labor protections, and welfare systems. How can we ensure that technological change uplifts rather than marginalizes? How do we build resilience into economies constantly being reshaped?
- The answers lie in foresight and flexibility. Lifelong learning, universal basic services, and agile economic policies may help economies not just survive disruption, but thrive within it. In this fast-moving era, the most important skill is the ability to adapt—and to help others adapt as well.
Economics: A Journey Through Choices and Consequences
Grasping the Patterns That Shape Our Daily Lives
Economics gives us a way to understand the hidden rhythms behind the world we see. Why does a loaf of bread cost more today than last year? What leads companies to hire or lay off workers? Why do some countries thrive while others struggle? These questions might seem complex, but economics helps us see the patterns and decisions behind them. It’s like learning to read the invisible threads that connect people, money, time, and priorities.
For students heading to university, this knowledge becomes more than academic. It’s practical. Whether you’re managing a household budget, watching global news, or preparing for a career in business or public service, economics helps you understand how decisions—small and large—shape outcomes. The subject empowers you to make sense of events, not just watch them happen. You’ll develop a deeper appreciation for how scarcity, incentives, and trade-offs influence the choices of individuals and societies alike.
Sharpening Minds with Logic and Numbers
Economics challenges students to think like detectives. You don’t just accept what you see—you ask why. You look for causes, consequences, and patterns. This process sharpens your ability to reason through problems clearly and make decisions based on facts rather than guesses. Through tables, graphs, equations, and data, you learn how to interpret the real world with clarity and precision.
As you dive into economic models and analyze statistics, you gain valuable experience in organizing information, spotting trends, and constructing arguments. These skills are prized in many university programs—from public policy to data science. But more importantly, they help you in life. You’ll be able to weigh pros and cons, challenge assumptions, and back up your ideas with logic. Whether you’re evaluating job offers or debating public policies, economics gives you tools to make smarter, more confident choices.
Engaging with the Challenges That Shape Our World
The study of economics is far from dry theory—it is alive with the urgent questions of our time. How do we tackle poverty without creating dependency? How can nations grow without polluting the planet? How do we reduce unemployment while controlling inflation? These are not abstract puzzles. They affect real people, in real places, every day.
When you study economics, you learn how to analyze policies, understand competing goals, and navigate trade-offs. You explore how governments decide where to invest, how businesses price goods, and how individuals respond to incentives. These explorations help you become a thoughtful, informed citizen—someone who can contribute to discussions about fairness, sustainability, and progress. If you’ve ever wondered how to make the world more just, efficient, or inclusive, economics gives you a place to start.
Seeing the Bridge Between Ideas and Real-World Impact
Economic theory isn’t locked away in textbooks—it shows up in everyday life. Think about how ride-sharing apps adjust prices during peak hours. Or how banks decide interest rates. Or how governments react during recessions. All these are practical expressions of economic ideas in motion.
By studying economics, students see how abstract principles—like opportunity cost or elasticity—play out in real decisions. You’ll learn to analyze case studies, run simulations, and critique policies. You’ll see how trade affects farmers and tech companies alike. And you’ll grasp how fiscal and monetary policies ripple through entire economies. This ability to connect theory with action equips you for university study where application is key. It also prepares you for a world where understanding how things work is essential to shaping what comes next.
Opening Doors to Meaningful and Versatile Careers
Economics isn’t just a subject—it’s a springboard. Whether your path leads to finance, international relations, law, entrepreneurship, or environmental policy, a background in economics provides a strong launchpad. The habits of mind you develop—curiosity, precision, adaptability—serve you well in any field.
Employers value the skills economists bring: clear communication, strategic thinking, and data literacy. Economists are problem-solvers who can think ahead and explain complex ideas in simple ways. Whether you’re advising on budgets, designing development programs, or analyzing market trends, your economics training will help you shine.
Even if your future role isn’t labeled “economist,” the perspective you gain will guide your choices, shape your ethics, and strengthen your leadership. In a world of rapid change and constant decision-making, economics offers not just answers—but a thoughtful way to seek them.
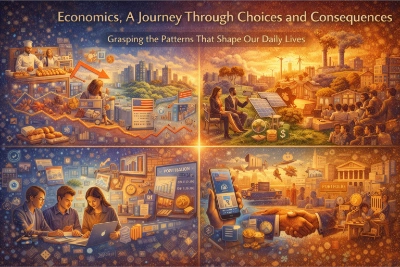
A quadrant-style educational illustration that presents economics as both practical and human. One panel connects daily life to economic forces through scenes of bread prices, workers, and trend lines that hint at inflation and employment shifts. Another shows students studying charts and data, emphasizing logic, numbers, and analytical skill-building. A third depicts policymakers and communities confronting real-world challenges such as development, sustainability, and social trade-offs. The final panel highlights how economic ideas appear in modern systems—digital platforms, interest rates, portfolios, and global exchange—showing how theory becomes action in markets and institutions.
Reflecting on the Power and Promise of Economics
Economics is more than a subject taught in lecture halls. It is a living language that helps us understand how the world moves—why some markets soar while others fall, why prices shift with the seasons, and why people make the choices they do. It’s the study of everyday life viewed through the lens of decisions, trade-offs, and human behavior. Whether you’re buying a coffee, voting in an election, or launching a business, economics is always quietly at play in the background, shaping outcomes.
At its heart, economics gives us tools to solve real problems. It teaches us how to think in terms of costs and benefits, of cause and effect. When faced with scarcity—a challenge common to every individual and every nation—economics helps us choose wisely. It draws from both mathematical logic and social insight, connecting numbers with narratives. This dual strength makes it a bridge between the abstract and the practical, between theory and action.
By exploring both microeconomics and macroeconomics, students learn to see the economy at many levels. On the micro side, they analyze individual decisions—how consumers respond to changes in price, how firms compete, and how supply meets demand. On the macro side, they examine the broader picture—growth, inflation, unemployment, and national budgets. These perspectives together form a more complete understanding of how our world operates, from a single household to a global economy.
In today’s fast-changing world, the value of economics has never been greater. The forces shaping our future—climate change, technological disruption, population shifts, and economic inequality—require both clarity and compassion. Economics offers both. It helps us weigh urgent needs against long-term consequences. It allows us to assess trade-offs with fairness and to craft solutions that balance efficiency with equity.
Imagine the role of economics in solving the climate crisis: it evaluates carbon pricing, incentivizes green innovation, and guides policies that protect both the planet and people’s livelihoods. Or think of how it navigates digital transformation: it helps us manage automation, measure the impact of artificial intelligence, and adapt our labor markets with foresight. In every corner of society—from agriculture to healthcare, from finance to education—economics offers a guiding hand.
As students prepare for higher learning or their future careers, a grounding in economics opens up endless paths. It cultivates curiosity, strengthens reasoning, and builds confidence in decision-making. It doesn’t just teach you what to think—it teaches you how to think. This skill is timeless, valuable not only in boardrooms and government offices but also in everyday life.
Economics also nurtures empathy. By studying how people respond to incentives and constraints, students come to understand the diverse experiences and pressures that shape behavior. Why does someone accept a low-paying job? Why do some communities struggle to access clean water or affordable housing? Economics doesn’t offer easy answers, but it gives us the tools to ask better questions—and to design better systems.
Whether you dream of running a business, designing public policy, advising world leaders, or simply becoming a more informed citizen, economics provides a sturdy foundation. It is the engine beneath so many disciplines, quietly powering innovation, stability, and progress. As the global landscape continues to evolve, economics adapts—offering new insights, new models, and new ways to shape a better future.
In the end, economics is not just about money or markets. It is about choices, values, and the kind of world we want to build together. With its blend of analytical rigor and human insight, it remains a compass for navigating complexity—and a beacon for those who hope to make a meaningful difference.