
Supply Chain Management (SCM) is a cornerstone of modern industrial success, encompassing the design, execution, and monitoring of all activities involved in sourcing, procurement, transformation, and logistics. As industries become more global and interconnected, mastering SCM is increasingly essential for integrating industrial and manufacturing technologies across dispersed networks and enabling timely, cost-effective, and quality-driven product delivery.
A supply chain is a long conversation between many strangers—suppliers, factories, ports, warehouses, retailers—each speaking in the language of time, cost, and uncertainty. SCM education teaches students to hear that conversation clearly, to notice where meaning is lost, and to restore coherence without forcing the system into brittle perfection. In this diagram, the inputs (logistics processes and supplier practices) bring the lived reality of how goods and information actually move, while the controls (curriculum topics and evaluation metrics) keep the learning disciplined: students must explain decisions, defend trade-offs, and show evidence of improvement. Within the central function, learners practice turning complexity into clarity—mapping flows, spotting bottlenecks, balancing inventory against service levels, and understanding why small delays can echo into large disruptions. The mechanisms—software and analytical tools—then provide a practical laboratory for thinking: scenarios can be tested, plans can be stress-checked, and assumptions can be challenged with data. The outputs are the real goal: trained students who can coordinate across boundaries, and operations that run with less friction—more reliable, more responsive, and more intelligently designed.
- Deterministic Inventory Control & Stochastic Buffering: Economic Order Quantity (\(\text{EOQ}\)), Reorder Point (\(\text{ROP}\)), safety stock derivation with stochastic lead-time variance, and the Square-Root Law for multi-facility pooling.
- Multi-Echelon Bullwhip Dynamics: Mathematical modeling of order variance amplification across multi-tier supplier echelons (\(\sigma^2_{\text{orders}} / \sigma^2_{\text{demand}} \gt 1\)) and mitigation via Point-of-Sale (POS) data transparency.
- Industry 4.0 Digital Supply Networks: Integration of AI demand sensing, IoT cold-chain telemetry, permissioned blockchain smart contracts, and real-time digital twin routing.
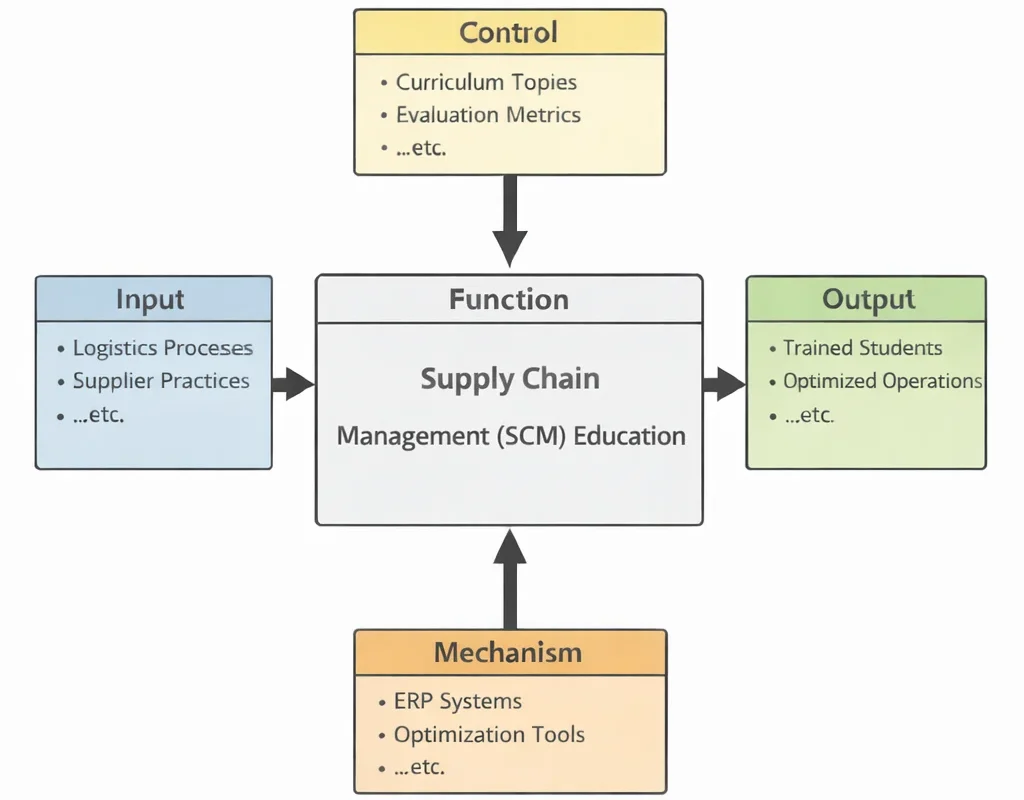
This IDEF0 (Input–Control–Output–Mechanism) diagram presents Supply Chain Management (SCM) Education as a coordinated learning system. Inputs on the left—logistics processes and supplier practices—provide real operational material for study. Controls at the top—curriculum topics and evaluation metrics—define what learners must cover and how mastery is assessed. The central function, Supply Chain Management (SCM) Education, transforms those inputs and controls into structured understanding and applied decision-making. Outputs on the right—trained students and optimized operations—reflect the intended outcomes: learners who can improve flow, coordination, and performance across a supply network. Mechanisms at the bottom highlight the enabling infrastructure (software and analytical tools) that supports practical learning through data, planning exercises, and operational analysis.
A well-orchestrated supply chain is no longer just about efficient transport—it’s deeply entwined with digital innovation. Technologies like Digital Twin Technology allow real-time modeling of logistics and inventory systems, providing predictive insights for proactive decision-making. Integration with Computer-Integrated Manufacturing (CIM) ensures that production data seamlessly flows through planning and distribution stages.
Efficiency-focused methodologies such as lean manufacturing have reshaped SCM by eliminating waste, improving flow, and enhancing responsiveness. Similarly, energy and resource efficiency initiatives align SCM with sustainability goals, reinforcing the role of green logistics in corporate responsibility.
Emerging trends like Smart Manufacturing and Industry 4.0 enhance agility through automation, IoT, and AI. These frameworks link upstream suppliers to downstream retailers using advanced analytics and autonomous systems. The growth of industrial automation and robotics has also streamlined repetitive logistics tasks and improved warehouse operations.
The evolution of SCM benefits from manufacturing domains such as Additive Manufacturing (3D Printing), which supports localized production and reduces transportation needs. When coupled with advanced materials and manufacturing technologies, these innovations enable faster, more customized outputs across diverse sectors.
Reliable SCM also hinges on robust process control. Topics such as manufacturing quality control and assurance and ergonomic design in manufacturing reduce variability and enhance worker productivity, ensuring operational consistency throughout the supply chain.
SCM spans a wide variety of engineering disciplines. For instance, manufacturing and production engineering sets the pace for throughput and lead times, while CAD-based mechanical design influences material sourcing and assembly strategies. The integration of control systems also plays a pivotal role in coordinating automated processes and inventory levels.
Broader applications include the role of SCM in automotive engineering, where just-in-time delivery models rely on hyper-optimized logistics. Similarly, the development of biomechanical engineering devices requires transparent supplier coordination to meet stringent regulatory timelines.
Other critical topics that feed into effective supply chain strategies include thermal management in packaging as discussed in thermodynamics and heat transfer, and structural optimization in transport systems explored in solid mechanics. Even fields like fluid mechanics influence warehouse heating, cooling, and automation systems.
A dynamic supply chain reflects the interconnected nature of modern production. With the rise of robotics in mechanical engineering, real-time inventory monitoring and decentralized decision-making are becoming mainstream. The strategic integration of nanotechnology and advanced materials adds further resilience to the global supply network.
Ultimately, Supply Chain Management is not merely a logistical concern but a multidisciplinary field that integrates engineering innovation, data intelligence, and strategic foresight. It prepares students to confront global challenges and drive operational excellence across industries.

Supply Chain Systems: Flow, Coordination, and Global Distribution Networks
Explore our comprehensive curriculum modules to see how core technologies integrate into cohesive, intelligent production workflows within the broader industrial engineering ecosystem:
Industrial & Manufacturing Technologies Overview
Connects production systems with logistics, distribution, and global market networks across the overarching curriculum roadmap.
Supply Chain Management (Current Topic)
Coordinates sourcing, production, transportation, and delivery to ensure efficient movement of goods and information across global networks.
Process Design
Aligns internal production workflows and facility layouts with external supply availability and volatile market demand dynamics.
Smart Manufacturing
Enables real-time, sensor-driven coordination between automated shop floors, enterprise cloud platforms, and supply networks.
Digital Twin
Simulates physical supply chain flows, port bottlenecks, and transit risks for dynamic route optimization and stress-testing.
Automation
Automates modern warehousing, AS/RS order picking, AGV material transport, and high-speed distribution operations.
CIM
Integrates upstream supply chain data seamlessly with manufacturing execution systems and factory-floor equipment.
Lean Manufacturing
Minimizes excess inventory holding, eliminates non-value-added lead times, and improves continuous flow across logistics paths.
Quality Control
Ensures rigorous component quality standards and regulatory compliance are maintained throughout the supply network.
Additive Manufacturing
Enables decentralized, tool-less production near point-of-use, simplifying spare part logistics and reducing transit delays.
Advanced Materials
Influences strategic raw material sourcing, specialized storage requirements, and high-performance material logistics.
Sustainable Manufacturing
Promotes environmentally responsible sourcing, circular reverse logistics, and carbon-footprint reduction initiatives.
Energy Efficiency
Optimizes fuel consumption, route planning, and warehouse energy loads across regional distribution networks.
Human Factors
Improves workforce safety, material handling ergonomics, and human-system efficiency in high-throughput distribution hubs.
Core Components of Supply Chain Management
Planning
- Demand Forecasting: Demand forecasting utilizes historical sales data, customer purchase trends, macroeconomic signals, and machine learning models to anticipate consumer demand. Accurate forecasting is critical for maintaining high cycle service levels while suppressing the bullwhip effect.
- Capacity Planning: Establishes production and handling limits based on lead times and facility constraints, ensuring optimal throughput without bottleneck formation.
- Supply Chain Network Design: Optimizes facility locations, cross-docking hubs, and regional distribution centers through mixed-integer linear programming (MILP).
Procurement
- Supplier Selection: Evaluates candidate vendors using Total Cost of Ownership (\(\text{TCO}\)) frameworks, assessing unit price, transit freight, import tariffs, defect rates, and pipeline carrying costs.
- Contract Management: Enforces legal delivery milestones, service level agreements (SLAs), and smart contracts executing automated escrow release.
- Strategic Sourcing: Unifies enterprise procurement to leverage economies of scale, establishing Vendor-Managed Inventory (VMI) partnerships.
Manufacturing
- Production Scheduling: Aligns fabrication runs with customer pull signals via Material Requirements Planning (MRP) and finite capacity scheduling.
- Lean Integration: Minimizes non-value-added storage buffers, balancing line takt times and reducing throughput lead time.
- Quality Assurance: Enforces rigorous supplier quality agreements and incoming statistical sampling to prevent downstream disruptions.
Inventory Management
- Inventory Optimization: Balances carrying costs against stockout penalties via Economic Order Quantity (\(\text{EOQ}\)) and dynamic safety stock algorithms.
- Just-In-Time (JIT): Pull-based replenishment delivering components directly to production cells moments before assembly.
- Safety Stock Buffering: Protects operational continuity against stochastic demand surges and supplier lead-time variance.
Logistics, Warehousing & Distribution
- Inbound & Outbound Logistics: Manages freight movement across intermodal networks via Transport Management Systems (TMS).
- Automated Warehousing: Employs Automated Storage and Retrieval Systems (AS/RS), autonomous mobile robots, and slotting optimization algorithms.
- Last-Mile Delivery: Solves vehicle routing problems (VRP) to execute fast, cost-effective regional delivery.
Information Flow & Returns Management
- End-to-End Visibility: IoT telematics, RFID scanning, and cloud ERPs track inventory positions in real time.
- Reverse Logistics: Manages customer returns, warranty repair routing, and closed-loop circular material recovery.
Contemporary Computational Paradigms: AI SCM & Neural Logistics
Modern supply chain networks operate as dynamic cyber-physical ecosystems. By integrating mathematical operations research with deep neural operators and decentralized ledgers, intelligent logistics networks predict global disruptions and stabilize material flows autonomously.
Stochastic Inventory Formulations & Safety Stock Modeling
Under uncertain customer demand and variable supplier transit delays, safety stock (\(\text{SS}\)) acts as a stochastic dampener. When daily demand exhibits standard deviation \(\sigma_d\) and supplier lead time exhibits variance \(\sigma_L^2\), the combined standard deviation during lead time (\(\sigma_{DL}\)) is expressed as:
$$\sigma_{DL} = \sqrt{\bar{L} \sigma_d^2 + \bar{d}^2 \sigma_L^2}$$
Where \(\bar{d}\) is mean daily demand and \(\bar{L}\) is mean lead time. The required safety stock and Reorder Point (\(\text{ROP}\)) for a target cycle service level \(Z\) are given by:
$$\text{SS} = Z \cdot \sigma_{DL}, \qquad \text{ROP} = (\bar{d} \cdot \bar{L}) + \text{SS}$$
When aggregating inventory across \(N\) independent regional warehouses into a centralized distribution center, the Square-Root Law of Inventory demonstrates that total network safety stock scales with \(\sqrt{N_{\text{new}} / N_{\text{old}}}\), freeing significant working capital.
Physics-Informed Neural Networks (PINNs) in Multi-Echelon Bullwhip Control
In multi-echelon supply chains, order variance amplifies upstream: \(\sigma^2_{\text{orders}} / \sigma^2_{\text{demand}} \gt 1\). Classical linear control laws struggle with non-linear capacity bottlenecks and ordering batch policies. Modern control frameworks deploy Physics-Informed Neural Networks (PINNs) to solve fluid-flow continuity equations representing factory inventory conservation:
$$\frac{\partial I(x, t)}{\partial t} + \nabla \cdot \mathbf{J}_{\text{flow}}(x, t) = S(x, t) - D(x, t)$$
Where \(I\) is inventory density, \(\mathbf{J}_{\text{flow}}\) represents logistics transport flux, \(S\) is production replenishment, and \(D\) is consumer consumption. By enforcing mass-balance conservation within the loss function, neural network controllers predict supply chain resonance and autonomously tune order smoothing parameters, preventing bullwhip oscillations across global supplier tiers.
Systems Engineering Trade-Off Matrix: Supply Chain Network Strategies
Designing modern supply chains requires managing critical trade-offs between inventory costs, transit speed, resilience, and geographic complexity:
| Supply Chain Strategy | Primary Operational Advantage | Systemic Risk & Failure Mode | Design Mitigation Strategy |
|---|---|---|---|
| Centralized Inventory Pooling | Reduces safety stock by up to \(50\%\) via Square-Root Law aggregation; lowers warehousing capital costs. | Increased last-mile delivery transit times and higher outbound freight shipping rates to regional customers. | Establish forward fulfillment micro-hubs stocked strictly with high-velocity "A-tier" fast-moving products. |
| Offshore Low-Cost Sourcing | Significantly lower unit labor and production expenses; access to specialized regional raw materials. | Extended maritime lead times (\(45\text{--}90\,\text{days}\)); tariff volatility; working capital locked in pipeline transit. | Implement dual-sourcing: allocate baseline volume offshore while reserving local nearshore suppliers for demand spikes. |
| Strict Just-In-Time (JIT) SCM | Minimizes working capital; zero warehouse holding footprint; defects exposed immediately. | Zero buffer for disruptions; minor transit delays halt entire downstream manufacturing assembly cells. | Maintain strategic buffer stocks exclusively for critical, long-lead-time, or single-source components. |
| Permissioned Blockchain Tracking | Immutable provenance verification; automated smart-contract escrow release; eliminates invoice dispute friction. | Supplier integration friction; data privacy concerns regarding proprietary vendor pricing information. | Deploy zero-knowledge proofs (ZKPs) and private enterprise ledgers (Hyperledger) to share proofs without exposing costs. |
Applications of Supply Chain Management
About This Interactive Simulator:
This dynamic simulator models multi-echelon supply chain inventory dynamics, demonstrating how lead time variability and demand fluctuations drive inventory amplification (the Bullwhip Effect) across suppliers, distribution centers, and retail stores.
- End-Customer Demand Volatility (%) [Solid Cyan Line]: Controls the percentage variability in retail customer purchasing rates per period. Higher volatility creates ripple effects upstream.
- Supplier Lead Time (Days) [Control Slider]: Sets the transit delay required for raw materials to be processed and delivered from Tier-1 suppliers.
- Order Batching Multiplier [Dashed Amber Line]: Simulates the operational impact of periodic bulk ordering policies versus continuous replenishment, highlighting safety stock accumulation.
Interactive Multi-Echelon Bullwhip Effect Simulator
Adjust parameters below to visualize how small retail demand changes amplify into large inventory oscillations upstream.
Retail and E-Commerce
- Managing high-velocity inventories, coordinating across multi-vendor networks, and executing rapid parcel fulfillment.
- Application of Just-In-Time (JIT) replenishment models in fast fashion (e.g., Zara) and omnichannel fulfillment networks.
- Automated distribution centers deploying goods-to-person robotic picking systems to compress click-to-dispatch windows.
Automotive Industry
- Orchestrating multi-tier supplier networks delivering modular engines, transmissions, and battery packs under strict takt times.
- Vendor-Managed Inventory (VMI) and sequenced line-side delivery eliminating plant floor storage buffers.
- Digital twins tracking shipping containers across maritime hubs to prevent body assembly line halts.
Healthcare and Pharmaceuticals
- Cold chain logistics ensuring strict continuous temperature control (\(2\text{--}8^\circ\text{C}\) or \(-80^\circ\text{C}\)) for vaccines and biologic therapies.
- Serialisation and RFID tagging complying with FDA and EMA regulations to prevent counterfeit drug penetration.
Aerospace and Defense
- Managing high-value, highly engineered components with rigorous AS9100 quality compliance records.
- Long-term raw material agreements securing critical titanium, nickel-based superalloys, and composite prepregs against global market shocks.
Benefits of Effective Supply Chain Management
- Total Landed Cost Reduction: Streamlining procurement, production scheduling, and transportation networks lowers overall operating spend. Freight consolidation (LTL to FTL) and inventory holding optimization reduce working capital requirements.
- Systemic Efficiency & Velocity: Enterprise Resource Planning (ERP) and Transport Management Systems (TMS) enable automated real-time dispatch, shortening cycle times and eliminating queue delays.
- Customer Fulfillment Reliability: Accurate demand sensing and dynamic inventory positioning improve On-Time In-Full (\(\text{OTIF}\)) delivery rates and protect brand equity.
- Network Resilience & Disruption Recovery: Multi-sourcing, nearshore redundancy, and real-time contingency routing insulate manufacturing lines against port closures and geopolitical trade barriers.
- Environmental Sustainability: Route optimization, consolidated freight, and circular reverse logistics minimize transportation emissions, aligning operations with ESG targets.
Challenges & Systemic Vulnerabilities in Implementation
- Global Trade Friction & Geopolitical Instability: Cross-border supply chains face tariff shifts, complex customs regulations, and transit bottlenecks that inflate lead times and require costly contingency inventories.
- Stochastic Demand Volatility & The Bullwhip Effect: Uncoordinated ordering and long replenishment lead times amplify small retail sales fluctuations into large upstream order swings, causing alternate cycles of inventory glut and stockouts.
- Enterprise IT/OT Data Silos: Legacy ERPs that fail to communicate seamlessly with supplier portals or warehouse management platforms prevent real-time shipment visibility.
- Supply Chain Cyber-Physical Risks: Integrating third-party supplier portals creates entry vectors for ransomware, requiring strict API-level microsegmentation and multi-factor authentication.
Emerging Trends in Supply Chain Management
- Autonomous Logistics & Dark Warehouses: High-throughput distribution hubs deploy autonomous mobile robots, automated palletizers, and drone inventory auditors operating 24/7 without ambient lighting.
- Blockchain-Verified Supply Traceability: Cryptographic ledgers verify component provenance, conflict-free mineral sourcing, and temperature compliance during pharmaceutical cold-chain transport.
- Nearshoring & Regional Supply Clustering: Manufacturers establish localized supplier hubs near consumer markets, trading offshore unit wage advantages for compressed lead times and reduced tariff risk.
- Circular Reverse Logistics Networks: Closed-loop return pathways harvest end-of-life electronic sub-assemblies and scrap metals, feeding recycled feedstock directly back into production cells.
Why Study Supply Chain Management
Coordinating the Flow of Goods and Services
Supply chain management involves planning and managing the flow of materials, information, and finances from suppliers to consumers. Students learn how to design and optimize supply chains for efficiency and reliability. This coordination is vital to business success and customer satisfaction.
Inventory, Logistics, and Procurement
Students study how to manage inventory levels, plan logistics networks, and negotiate with suppliers. These functions ensure that products are delivered on time and within budget. Effective procurement strategies reduce costs and increase competitiveness.
Technology and Digital Supply Chains
The course introduces ERP systems, supply chain analytics, and blockchain for traceability. Students learn how technology enhances visibility, responsiveness, and decision-making. This prepares them for modern, data-driven operations.
Risk Management and Global Operations
Students explore how to identify and mitigate risks such as disruptions, delays, and geopolitical issues. They study global sourcing, trade regulations, and contingency planning. This ensures resilient and adaptive supply networks.
Strategic Role in Business Success
Supply chain decisions influence profitability, sustainability, and innovation. Students learn how to align supply chain strategies with business goals. This prepares them for leadership roles in operations and logistics.
Supply Chain Management: Conclusion
Supply Chain Management (SCM) serves as a foundational pillar for the success and sustainability of modern businesses. It encompasses the strategic coordination of planning, procurement, manufacturing, inventory management, logistics, distribution, information flow, and returns management to ensure the smooth and efficient movement of goods, services, and capital. Effective SCM not only improves internal operations but also enhances customer satisfaction, builds competitive advantage, and strengthens brand reputation across global markets.
With the rise of globalization and the complexity of international networks, SCM has evolved into a dynamic discipline that integrates cross-functional processes and real-time decision-making. Technologies such as artificial intelligence, the Internet of Things (IoT), blockchain, and digital twins have transformed traditional supply chains into intelligent ecosystems capable of predictive analysis, automation, and agile responses. These innovations enable companies to anticipate disruptions, optimize performance, and adapt rapidly to changing consumer demands.
Moreover, sustainability has become a key driver in supply chain strategies, prompting organizations to adopt environmentally responsible practices, from reducing emissions and packaging waste to sourcing materials ethically. Risk management, too, plays a critical role as supply chains face threats from geopolitical tensions, natural disasters, pandemics, and cybersecurity breaches. Building resilient and transparent supply networks ensures continuity and trust in an era of volatility and uncertainty.
As the business landscape continues to evolve, so will the principles and applications of supply chain management. The future will be marked by hyper-automation, personalized logistics, circular supply chains, and collaborative digital platforms that bring together partners, suppliers, and customers in seamless integration. In this transformative era, SCM will remain central to driving innovation, cost-efficiency, and global competitiveness, helping organizations thrive in increasingly interconnected and data-driven markets.
Frequently Asked Questions
1. What is supply chain management in a manufacturing context?
2. How does supply chain management differ from logistics?
3. How do digital technologies and Industry 4.0 improve supply chain management?
4. What is the bullwhip effect, and why is it a problem in supply chains?
5. What is the difference between Just-In-Time and Just-In-Case inventory strategies?
6. Which key performance indicators (KPIs) are commonly used in supply chain management?
7. How can supply chain management support sustainability and the circular economy?
8. Why is collaboration between supply chain partners so important?
Supply Chain Management: Comprehensive Student Exercises
Core Concept Review Modules
1. What are the key components of an effective Supply Chain Management system?
2. How does Just-In-Time (JIT) inventory management improve efficiency?
3. What role does technology play in enhancing supply chain visibility?
4. How can data analytics improve demand forecasting accuracy?
5. What strategies mitigate supply chain risks and ensure resilience?
6. How does Lean manufacturing contribute to overall supply chain efficiency?
7. How are sustainability practices integrated into modern SCM?
8. What is the significance of Supplier Relationship Management (SRM)?
Analytical & Strategic Thought Scenarios
1. Scenario: Mitigating the Bullwhip Effect in Multi-Tier Networks
2. Scenario: Trade-off Analysis: Nearshoring vs. Offshore Low-Cost Sourcing
3. Scenario: Reverse Logistics Architecture for E-Commerce Operations
4. Scenario: Blockchain Integration for Pharmaceutical Cold Chain Management
5. Scenario: Dynamic Safety Stock Allocation in Global Distribution Networks
6. Scenario: Sales and Operations Planning (S&OP) Alignment Under Capacity Constraints
7. Scenario: Cybersecurity Vulnerabilities in Vendor-Managed Inventory (VMI) Portals
8. Scenario: Circular Economy Integration in Electronics Supply Chains
9. Scenario: Impact of 5G and Edge AI on Autonomous Fleet Routing
Quantitative & Mathematical Calculations
Work through these step-by-step mathematical problems to master quantitative decision-making in supply chain management, inventory optimization, and logistics engineering.
Problem 1: Economic Order Quantity (EOQ) and Total Inventory Cost
Problem Statement: A manufacturing plant has an annual demand \(D = 12{,}000\,\text{units}\) for a specific raw component. The fixed ordering cost is \(S = \$150.00\,\text{per order}\), and the annual holding cost per unit is \(H = \$4.00\,\text{per unit/year}\). Calculate the Economic Order Quantity (\(\text{EOQ}\)), the total number of orders placed per year, and the total annual inventory cost (holding plus ordering).
Step 1: Calculate Economic Order Quantity (\(\text{EOQ}\))
$$\text{EOQ} = \sqrt{\frac{2 \cdot D \cdot S}{H}} = \sqrt{\frac{2 \times 12{,}000 \times 150}{4.00}} = \sqrt{\frac{3{,}600{,}000}{4.00}} = \sqrt{900{,}000} = \mathbf{900\,\text{units}}$$
Step 2: Calculate Number of Orders Placed Per Year
$$N_{\text{orders}} = \frac{D}{\text{EOQ}} = \frac{12{,}000}{900} = \mathbf{13.33\,\text{orders/year}}$$
Step 3: Calculate Annual Ordering Cost
$$\text{Cost}_{\text{order}} = N_{\text{orders}} \times S = 13.333 \times \$150.00 = \mathbf{\$2{,}000.00/\text{year}}$$
Step 4: Calculate Annual Inventory Holding Cost
$$\text{Cost}_{\text{hold}} = \left( \frac{\text{EOQ}}{2} \right) \times H = \left( \frac{900}{2} \right) \times \$4.00 = 450 \times \$4.00 = \mathbf{\$1{,}800.00/\text{year}}$$
Step 5: Calculate Total Annual Inventory Management Cost
$$\text{Cost}_{\text{total}} = \text{Cost}_{\text{order}} + \text{Cost}_{\text{hold}} = \$2{,}000.00 + \$1{,}800.00 = \mathbf{\$3{,}800.00/\text{year}}$$
Engineering Interpretation: Ordering in lots of \(900\,\text{units}\) balances administrative purchase order setup with working capital holding charges, minimizing inventory-related operating costs.
Problem 2: Safety Stock and Reorder Point (ROP) Under Demand Uncertainty
Problem Statement: A retail distribution center experiences an average daily demand \(\bar{d} = 250\,\text{units/day}\) with a daily demand standard deviation \(\sigma_d = 35\,\text{units}\). Supplier lead time is deterministic at \(L = 9\,\text{days}\). The target cycle service level corresponds to \(Z = 1.65\) (\(95\%\) non-stockout probability). Determine required Safety Stock (\(\text{SS}\)) and Reorder Point (\(\text{ROP}\)).
Step 1: Standard Deviation of Demand During Lead Time (\(\sigma_L\))
$$\sigma_L = \sigma_d \sqrt{L} = 35 \times \sqrt{9} = 35 \times 3 = \mathbf{105\,\text{units}}$$
Step 2: Safety Stock (\(\text{SS}\)) Calculation
$$\text{SS} = Z \cdot \sigma_L = 1.65 \times 105 = 173.25 \approx \mathbf{174\,\text{units}}$$
Step 3: Expected Lead Time Demand (\(\text{LTD}\))
$$\text{LTD} = \bar{d} \cdot L = 250\,\frac{\text{units}}{\text{day}} \times 9\,\text{days} = \mathbf{2{,}250\,\text{units}}$$
Step 4: Reorder Point (\(\text{ROP}\)) Resolution
$$\text{ROP} = \text{LTD} + \text{SS} = 2{,}250 + 174 = \mathbf{2{,}424\,\text{units}}$$
Engineering Interpretation: A purchase order must be issued immediately when inventory drops to \(2{,}424\,\text{units}\). The \(174\text{-unit}\) buffer protects the facility against daily sales variations during the 9-day replenishment window.
Problem 3: Square-Root Law for Inventory Consolidation
Problem Statement: A regional electronics distributor operates \(N_{\text{old}} = 4\) decentralized warehouses holding a combined safety stock \(\text{SS}_{\text{total}} = 8{,}000\,\text{units}\). The company plans to consolidate all stock into \(N_{\text{new}} = 1\) centralized distribution center. Assuming independent and identically distributed regional demand, calculate the new safety stock requirement and the percentage reduction in holding buffer.
Step 1: Square-Root Law Formulation
$$\text{SS}_{\text{central}} = \text{SS}_{\text{total}} \sqrt{\frac{N_{\text{new}}}{N_{\text{old}}}} = 8{,}000 \times \sqrt{\frac{1}{4}} = 8{,}000 \times 0.50 = \mathbf{4{,}000\,\text{units}}$$
Step 2: Buffer Reduction Evaluation
$$\Delta \text{SS} = 8{,}000 - 4{,}000 = \mathbf{4{,}000\,\text{units}}$$
$$\text{Reduction}_{\%} = \left( \frac{4{,}000}{8{,}000} \right) \times 100\% = \mathbf{50.0\%}$$
Engineering Interpretation: Centralizing inventory eliminates \(50.0\%\) of safety stock through statistical risk pooling, reducing capital requirements while maintaining the identical customer fill rate.
Problem 4: Total Cost of Ownership (TCO) Supplier Selection
Problem Statement: A manufacturer procures \(50{,}000\,\text{units/year}\) of a critical metal casting and evaluates two suppliers:
• Supplier A (Offshore): Unit purchase price = \(\$12.00\), freight = \(\$2.50/\text{unit}\), tariff = \(10\%\) of unit price, defect rate = \(3.0\%\) (scrap penalty = \(\$15.00/\text{unit}\)), lead time = \(60\,\text{days}\) (pipeline carrying cost = \(\$0.40/\text{unit}\)).
• Supplier B (Domestic): Unit purchase price = \(\$15.50\), freight = \(\$0.80/\text{unit}\), tariff = \(\$0.00\), defect rate = \(0.5\%\) (scrap penalty = \(\$15.00/\text{unit}\)), lead time = \(7\,\text{days}\) (pipeline carrying cost = \(\$0.05/\text{unit}\)).
Determine \(\text{TCO}\) per unit for both vendors and state the economical choice.
Step 1: Calculate TCO for Supplier A (Offshore)
$$\text{Tariff}_A = 0.10 \times \$12.00 = \$1.20$$
$$\text{Defect Penalty}_A = 0.03 \times \$15.00 = \$0.45$$
$$\text{TCO}_A = \$12.00 + \$2.50 + \$1.20 + \$0.45 + \$0.40 = \mathbf{\$16.55\,\text{per unit}}$$
Step 2: Calculate TCO for Supplier B (Domestic)
$$\text{Tariff}_B = \$0.00$$
$$\text{Defect Penalty}_B = 0.005 \times \$15.00 = \$0.075$$
$$\text{TCO}_B = \$15.50 + \$0.80 + \$0.00 + \$0.075 + \$0.05 = \mathbf{\$16.425\,\text{per unit}}$$
Step 3: Annualized Financial Comparison
$$\Delta \text{TCO} = \$16.55 - \$16.425 = \$0.125\,\text{per unit}$$
$$\text{Annual Net Savings} = 50{,}000 \times \$0.125 = \mathbf{\$6{,}250.00/\text{year}}$$
Engineering Interpretation: Despite a higher purchase price (\(\$15.50\) vs. \(\$12.00\)), Supplier B delivers lower Total Cost of Ownership due to zero tariffs, lower transit freight, minimal pipeline holding, and superior quality conformance.
Problem 5: Bullwhip Effect Variance Ratio Quantification
Problem Statement: A supply chain node experiences retail demand variance \(\sigma^2_{\text{demand}} = 120\,\text{units}^2\). Due to order batching and replenishment lead times, the variance of orders placed to the upstream Tier-1 supplier amplifies to \(\sigma^2_{\text{orders}} = 380\,\text{units}^2\). Calculate the Bullwhip Measure (variance ratio) and determine percentage volatility amplification.
Step 1: Bullwhip Ratio Formulation
$$\text{Bullwhip Measure} = \frac{\sigma^2_{\text{orders}}}{\sigma^2_{\text{demand}}} = \frac{380}{120} \approx \mathbf{3.17}$$
Step 2: Percentage Volatility Increase Calculation
$$\Delta \text{Volatility}_{\%} = \left( \frac{380 - 120}{120} \right) \times 100\% = \frac{260}{120} \times 100\% = \mathbf{216.67\%}$$
Engineering Interpretation: A variance ratio of \(3.17\) indicates severe bullwhip distortion. Upstream suppliers experience more than triple the demand volatility of the retail tier, driving excess safety stock and manufacturing scheduling churn.
Problem 6: Freight Transportation Load Consolidation Cost Savings
Problem Statement: A manufacturer dispatches \(50\,\text{individual LTL (Less-Than-Truckload)}\) shipments per month at a flat rate of \(\$350.00\,\text{per shipment}\). Logistics evaluates consolidating these orders into \(4\,\text{Full-Truckload (FTL)}\) movements per month at \(\$2{,}200.00\,\text{per truckload}\), plus a monthly cross-dock handling fee of \(\$1{,}500.00\). Compute monthly and annual cost savings and percentage freight spend reduction.
Step 1: Baseline LTL Shipping Cost
$$\text{Cost}_{\text{LTL}} = 50\,\text{shipments} \times \$350.00 = \mathbf{\$17{,}500.00/\text{month}}$$
Step 2: Consolidated FTL Shipping Cost
$$\text{Cost}_{\text{FTL}} = (4 \times \$2{,}200.00) + \$1{,}500.00 = \$8{,}800.00 + \$1{,}500.00 = \mathbf{\$10{,}300.00/\text{month}}$$
Step 3: Net Savings Resolution
$$\text{Savings}_{\text{monthly}} = \$17{,}500.00 - \$10{,}300.00 = \mathbf{\$7{,}200.00/\text{month}}$$
$$\text{Savings}_{\text{annual}} = \$7{,}200.00 \times 12 = \mathbf{\$86{,}400.00/\text{year}}$$
$$\text{Reduction}_{\%} = \left( \frac{\$7{,}200.00}{\$17{,}500.00} \right) \times 100\% \approx \mathbf{41.14\%}$$
Engineering Interpretation: Freight consolidation cuts monthly shipping expenditures by \(41.14\%\) (\(\$86{,}400/\text{year}\)) while reducing overall logistics transport carbon emissions.