
Industrial Ecology and the Circular Economy represent a transformative shift in how we design, operate, and evaluate modern industrial systems. Rather than following the traditional linear model of “take, make, dispose,” these approaches advocate for regenerative systems in which resource use, waste generation, and environmental impact are continuously minimized. This systems-based thinking integrates ecological principles into industrial operations, encouraging closed-loop cycles where materials and energy are reused efficiently across various sectors. This holistic vision aligns strongly with the goals of Environmental Engineering, helping aspiring engineers understand the symbiotic relationship between technology and nature.
- Industrial Metabolism & Flow Dynamics: Formulate steady-state mass balances using Material Flow Analysis (MFA), evaluate resource productivity, and model thermodynamic waste heat cascading.
- Life Cycle Assessment (LCA) Frameworks: Execute ISO 14040/44 compliant cradle-to-cradle environmental impact accounting, quantifying cumulative energy demand (CED), global warming potential (GWP), and avoided virgin extraction burdens.
- Industrial Symbiosis & Circular Business Models: Model by-product exchange networks across eco-industrial parks (e.g., Kalundborg), closed-loop water recovery (ZLD), and Product-as-a-Service (PaaS) asset retention.
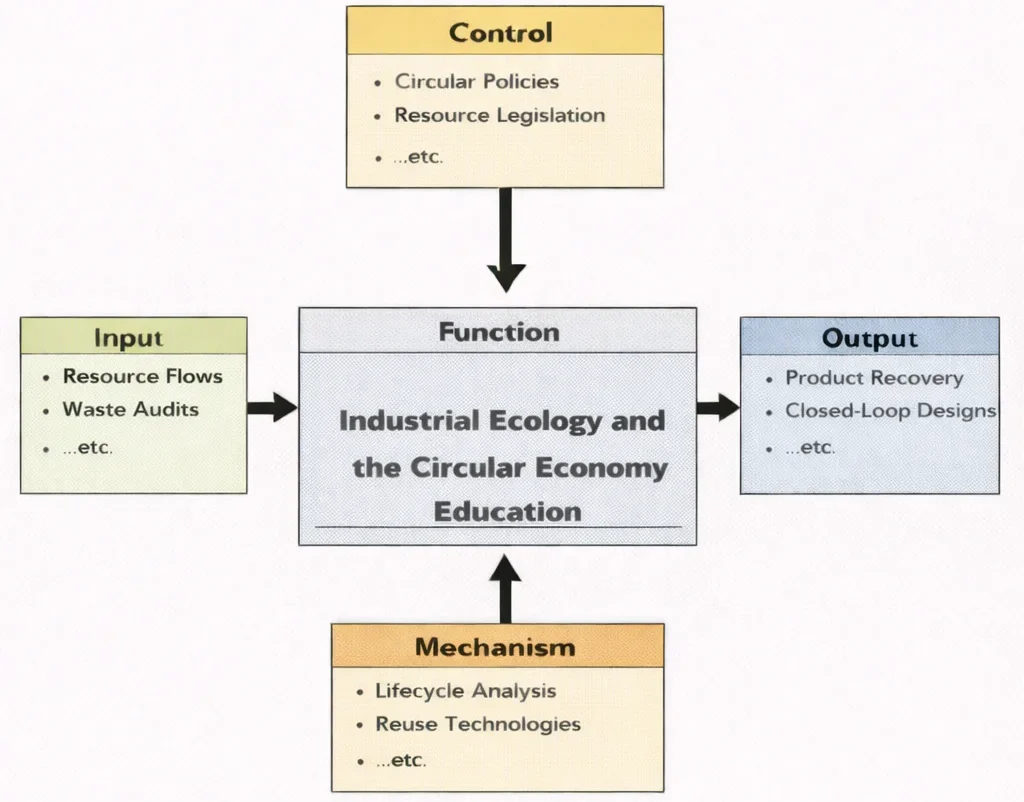
This IDEF0 diagram maps the learning “engine” of Industrial Ecology and the Circular Economy Education. On the left, inputs such as material and energy flow information, waste/by-product streams, and lifecycle inventory data enter the central function. From the top, controls—regulations, reporting frameworks, circular-economy principles, and organisational targets—shape what counts as acceptable and responsible design. On the bottom, mechanisms (the practical enablers) include lifecycle assessment methods and software, industrial symbiosis partnerships, measurement/monitoring systems, and analytical workflows. The outputs on the right represent actionable outcomes: circular design proposals, resource-efficiency improvements, closed-loop strategies, and decisions that reduce environmental impact while maintaining real-world feasibility.
At the core of the Circular Economy is the concept of designing out waste. This begins with rethinking how products are conceptualized and manufactured, ensuring that every component is either recyclable, biodegradable, or reusable. One practical application lies in shifting to biodegradable polymers and bio-based materials that degrade harmlessly, reducing dependence on persistent plastics. These materials often find synergy with innovations in Air Quality Engineering, where low-emission materials and advanced filtration systems contribute to cleaner industrial zones and healthier urban air.
Beyond materials, circular thinking influences how systems are structured. For example, industrial symbiosis allows the waste or by-products of one process to become the feedstock for another. This is increasingly common in eco-industrial parks, where shared infrastructures for waste heat, materials exchange, or water reuse drive down emissions. These collective practices support national and international efforts to mitigate and adapt to climate change, as industries must play a leading role in reducing greenhouse gas emissions.
To support such complex systems, professionals must rely on accurate, real-time data to monitor flows and feedback. That’s where Environmental Monitoring and Data Analysis becomes indispensable. Tools such as lifecycle assessment (LCA), material flow analysis (MFA), and Geographic Information Systems (GIS) help map the impact of industrial operations over time and space. These data-driven approaches also inform regulations under Environmental Policy and Management, shaping laws that mandate emissions caps, recycling quotas, and reporting requirements.
Interactive System Dynamics: Closed-Loop Industrial Symbiosis & Decarbonization Simulator
Simulate multi-year trajectories of industrial resource circularity and greenhouse gas emissions across a manufacturing cluster. Adjust secondary material recovery rates, renewable energy integration, and eco-design symbiosis factors to evaluate economic and thermodynamic performance in real time.
Circularity Parameters
One highly visible application of circular design can be seen in Green Building practices, where architects and engineers integrate sustainability into every aspect of construction—from site planning and materials selection to energy systems and end-of-life disassembly. This reduces both embodied carbon and operational emissions. Projects like these illustrate the systemic nature of circular thinking, combining disciplines to deliver performance and environmental benefit simultaneously. In fact, many cities now include circular design principles in building codes and urban planning guidelines, illustrating how widespread these practices are becoming across the built environment.
In parallel, clean energy systems support industrial circularity by decarbonizing production and logistics. Renewable Energy Systems Engineering facilitates the integration of solar arrays, wind farms, and bioenergy plants into factories, warehouses, and data centers. These distributed power sources help reduce dependency on fossil fuels and support the growing demand for low-carbon products. Many companies now pursue circularity targets aligned with global sustainability frameworks, underscoring the urgency and value of transitioning to closed-loop industrial systems.
Waste management is another foundational pillar of the circular economy, moving beyond simple disposal toward recovery, reuse, and reintegration. Through Waste Management Engineering, professionals develop methods for material separation, composting, anaerobic digestion, and thermochemical conversion. Advanced waste-to-energy plants, for instance, convert organic waste into electricity and heat while minimizing landfilling. These strategies not only lower the environmental burden but also create new economic value from discarded materials, reshaping how we define and manage waste across sectors.
Achieving these efficiencies requires rethinking manufacturing from the ground up. Knowledge in Industrial and Manufacturing Technologies enables engineers to redesign production systems that use fewer resources and generate less waste. For example, Additive Manufacturing (3D printing) allows for near-zero material waste, on-demand customization, and decentralized production, all of which align well with circular goals. Similarly, Advanced Materials like graphene composites or self-healing polymers extend product lifespans and reduce replacement needs.
Increasingly, digital technologies are enabling precise tracking and management of material life cycles. Digital Twin Technology allows for real-time simulations of entire production lines or supply chains, predicting when components will fail or require maintenance. This prevents premature replacement and supports proactive resource planning. Meanwhile, Computer-Integrated Manufacturing ensures seamless coordination between design, production, and quality control, reducing idle time and raw material use. The combination of these tools strengthens energy and resource efficiency throughout the manufacturing value chain.
In practice, applying circular principles at scale often involves streamlining processes for leaner outcomes. Lean Manufacturing contributes methodologies for eliminating unnecessary steps and materials, fostering a culture of continuous improvement. This minimizes overproduction, overprocessing, and underutilization of assets. In addition, integrating human factors ensures that circular systems remain practical and safe for operators, technicians, and maintenance personnel. It also promotes inclusion and skill development among the industrial workforce, enhancing long-term system resilience.
To maintain high standards while using recovered or remanufactured materials, stringent oversight is critical. Manufacturing Quality Control and Assurance guarantees that all products, regardless of origin, perform reliably and meet regulatory specifications. Advanced statistical tools, real-time defect tracking, and automated inspection systems are increasingly being used to ensure uniformity. These innovations build trust in recycled goods, making it easier for consumers and businesses to embrace circular solutions without compromising quality or performance.
The integration of smart systems under the umbrella of Smart Manufacturing and Industry 4.0 is rapidly transforming industrial ecology. Through AI, IoT sensors, and machine learning algorithms, industries can analyze real-time data to adjust operations dynamically—reducing energy use, predicting maintenance needs, and optimizing supply chains. This enables responsive manufacturing that adapts to environmental constraints and resource availability. The rise of self-regulating systems also introduces the potential for decentralized production nodes that support local economies while reducing transportation emissions and material redundancies.
The circular economy’s relevance extends beyond material recovery—it redefines the role of energy within industrial systems. The adoption of Renewable Energy Systems Engineering ensures that production cycles are powered by low-carbon, sustainable energy sources such as wind, solar, and bioenergy. Energy storage solutions like batteries and hydrogen cells further enable industries to decouple from fossil fuel dependency. These shifts are key to achieving decarbonized operations and aligning with international climate commitments such as the Paris Agreement, which has catalyzed global investment in energy efficiency and green infrastructure. For example, this overview of the circular economy by the Ellen MacArthur Foundation provides a comprehensive view of how industries are reengineering energy use to support regenerative models.
Water is another vital resource often overlooked in circular strategies. Through the principles of Water Resources Engineering, industries implement closed-loop water systems that recycle greywater, harvest rainwater, and reduce reliance on freshwater withdrawals. This is especially critical in arid regions or water-stressed industries like textiles, mining, and agriculture. Techniques such as membrane filtration, constructed wetlands, and zero-liquid discharge (ZLD) systems are increasingly being adopted to minimize water footprints while preserving surrounding ecosystems.
Curriculum Map & Specialization Pathways
Explore where Industrial Ecology & Circular Economy fits within the broader Environmental Engineering curriculum framework. Each card outlines strategic relationships and learning objectives across related disciplines:
Environmental Engineering – Overview
Foundational hub examining how core engineering principles intersect with environmental protection, systemic risk management, and technological innovation.
Air Quality Engineering
Focuses on low-emission material production, industrial filtration, and atmospheric monitoring essential for sustainable zone planning.
Water Resources Engineering
Explores closed-loop industrial water reuse, zero-liquid discharge (ZLD) systems, and regional hydrological management.
Waste Management Engineering
Covers thermochemical conversion, material separation, and energy recovery techniques required for closed-loop resource cycles.
Renewable Energy Systems Engineering
Details the integration of solar, wind, and bioenergy microgrids to power low-carbon, regenerative industrial operations.
Industrial Ecology & Circular Economy (Current Page)
Focuses on systems design, material flow analysis (MFA), life cycle assessment (LCA), and industrial symbiosis networks.
Green Building & Sustainable Design
Applies circularity to the built environment through modular architecture, design for disassembly, and low embodied carbon.
Environmental Policy & Management
Examines Extended Producer Responsibility (EPR), regulatory standards, and legal compliance frameworks driving circular markets.
Environmental Monitoring & Data Analysis
Leverages IoT sensors and spatial analytics to track real-time resource throughput and verify environmental performance metrics.
Ecological Engineering
Integrates natural ecosystems, biomimicry, and constructed wetlands to process biological nutrient loops and restore habitats.
Climate Change Mitigation & Adaptation
Addresses macro-level carbon budgets and systemic climate adaptation strategies strengthened by closed-loop supply chains.
Core Concepts in Industrial Ecology
Systems Thinking
Systems thinking is a foundational concept in industrial ecology, emphasizing the interconnection between industrial processes, environmental impacts, and socio-economic outcomes. Rather than examining a single component of a production system in isolation, systems thinking evaluates how all parts interact within a broader context. For example, a manufacturing facility’s energy use cannot be understood independently of its supply chain logistics, employee behavior, or waste management practices. This holistic perspective helps identify hidden inefficiencies and leverage points where small interventions lead to significant improvements.
Systems thinking also allows engineers and sustainability professionals to assess unintended consequences and feedback loops. A change in raw material sourcing might reduce carbon emissions but increase water usage downstream—an insight only visible through system-level modeling. Tools like causal loop diagrams and stock-and-flow models enable visualization of these complex dynamics. Thwink.org offers valuable resources and examples for understanding how systems thinking applies to sustainability and industrial design.
Material and Energy Flow Analysis
Material Flow Analysis (MFA) and Energy Flow Analysis (EFA) are critical methodologies in industrial ecology for tracking the inputs, transformations, and outputs of resources based on the principle of mass and energy conservation (\(\sum \dot{m}_{\text{in}} = \sum \dot{m}_{\text{out}} + \Delta \text{Stock}\)). These analyses visualize how raw materials, semi-finished goods, and waste products move through industrial networks. MFA, for instance, reveals how bauxite is refined, cast into automotive panels or beverage cans, and collected for secondary remelting. Understanding these flows allows industries to eliminate leakage and improve material circularity.
Energy Flow Analysis complements MFA by detailing how primary exergy is generated, utilized, and degraded into low-temperature waste heat. Examining cogeneration and district steam sharing supports industrial decarbonization. Advanced flow analyses use Sankey diagrams to visualize quantitative relationships between mass-energy streams, empowering engineers to execute data-driven resource optimizations.
Life Cycle Assessment (LCA)
Life Cycle Assessment (LCA) is a standardized method (governed by ISO 14040/14044) for compiling and evaluating the inputs, outputs, and potential environmental impacts of a product system throughout its entire lifecycle—from raw material extraction ("cradle") through processing, distribution, and use, to final disposal or remanufacturing ("grave" or "cradle"). This analysis prevents burden shifting, ensuring that interventions reducing emissions during operation do not drastically increase toxicity or embodied carbon during manufacturing.
Industrial Symbiosis
Industrial symbiosis engages traditionally separate industries in a collective approach to competitive advantage involving physical exchange of materials, energy, water, and by-products. The Kalundborg Symbiosis in Denmark remains the premier global benchmark, where power generation, pharmaceutical manufacturing, oil refining, and municipal district heating exchange steam, wastewater, fly ash, and biomass sludge to eliminate landfilling and reduce freshwater extraction.
Problem Formulation: Steady-State Aluminum Smelting MFA & Ellen MacArthur Material Circularity Indicator (MCI)
An industrial ecology engineer conducts a steady-state Material Flow Analysis (MFA) for an automotive component manufacturing cluster processing \(M = 20,000.0\text{ metric tons/year}\) of aluminum sheet. The plant incorporates internal scrap recycling, closed-loop return stamping scrap, and post-consumer end-of-life recovery. Determine the Linear Flow Index (\(\text{LFI}\)), the Utility factor (\(X\)), and the final Material Circularity Indicator (\(\text{MCI}\)) based on the Ellen MacArthur Foundation methodology.
- Total annual product mass output: \(M = 20,000.0\text{ t/yr}\)
- Virgin raw material input: \(V = 6,000.0\text{ t/yr}\) (Virgin feedstock fraction \(F_V = V/M = 0.300\))
- Recycled content feedstock input: \(R_C = 14,000.0\text{ t/yr}\) (Recycled fraction \(F_R = R_C/M = 0.700\))
- Unrecoverable waste generated during manufacturing: \(W_0 = 1,200.0\text{ t/yr}\)
- Product end-of-life collection fraction for recycling: \(C_R = 0.850\) (\(17,000.0\text{ t/yr}\) collected)
- Secondary recycling process recycling efficiency: \(E_C = 0.900\)
- Primary recycling efficiency of feedstock source: \(E_F = 0.920\)
- Design product operational lifespan: \(L = 12.0\text{ years}\) (Industry standard average \(L_{\text{avg}} = 8.0\text{ years}\))
- Product functional intensity: \(U = 1.00\) (equal to industry average usage rate)
Step 1: Quantify Unrecoverable Waste Flows (\(W\))
Unrecoverable waste comprises manufacturing waste and end-of-life uncollected/un-recycled fractions:
$$W_C = M \cdot (1 - C_R) + M \cdot C_R \cdot (1 - E_C)$$ $$W_C = 20,000 \times (1 - 0.850) + 20,000 \times 0.850 \times (1 - 0.900) = 3,000.0 + 1,700.0 = 4,700.0\text{ t/yr}$$Add manufacturing scrap loss:
$$W = W_0 + W_C = 1,200.0 + 4,700.0 = \mathbf{5,900.0\text{ metric tons/year}}$$Step 2: Calculate the Linear Flow Index (\(\text{LFI}\))
The Linear Flow Index measures the proportion of material flowing on linear pathways (virgin input to landfill waste):
$$\text{LFI} = \frac{V + W}{2M + \frac{W_0 - W_C \cdot (1 - E_F)}{2}} \approx \frac{V + W}{2M}$$ $$\text{LFI} = \frac{6,000.0 + 5,900.0}{2 \times 20,000.0} = \frac{11,900.0}{40,000.0} = \mathbf{0.2975}$$Step 3: Determine the Utility Factor Function (\(F(X)\))
Evaluate product lifetime multiplier relative to industry benchmark:
$$X = \left(\frac{L}{L_{\text{avg}}}\right) \times \left(\frac{U}{U_{\text{avg}}}\right) = \left(\frac{12.0}{8.0}\right) \times 1.00 = 1.500$$Apply the standard hyperbolic utility scaling function:
$$F(X) = \frac{0.90}{X} = \frac{0.90}{1.500} = \mathbf{0.600}$$Step 4: Compute the Ellen MacArthur Material Circularity Indicator (\(\text{MCI}\))
Calculate overall circularity index on a normalized scale from \(0.0\) (completely linear) to \(1.0\) (perfectly circular):
$$\text{MCI}^* = 1.0 - \text{LFI} \cdot F(X) = 1.0 - (0.2975 \times 0.600) = 1.0 - 0.1785 = \mathbf{0.8215}$$ $$\text{MCI} = \max(0.0, \, \text{MCI}^*) = \mathbf{0.822}\quad (\mathbf{82.2\%})$$Systems Engineering Trade-Off Matrix: Industrial Ecology & Circular Strategies
Selecting resource recovery interventions across industrial clusters requires balancing mass diversion yield, thermodynamic exergy retention, capital intensity, and cross-enterprise contamination risks.
| Circularity Strategy | Primary Process | Mass & Exergy Recovery | Embodied Energy Reduction | Contamination & Failure Modes | Cross-Sector Symbiosis Potential |
|---|---|---|---|---|---|
| Mechanical Closed-Loop Recycling | Shredding, optical sorting, remelting/re-extrusion | Mass yield \(85 - 95\%\); high exergy preservation | Saves \(80 - 95\%\) energy vs. primary smelting | Polymer chain degradation; alloy tramp metal accumulation | High; direct scrap exchange between stampers and smelters |
| Chemical Depolymerization / Pyrolysis | Solvolysis, thermal cracking into purified monomers | Restores virgin polymer purity; mass yield \(60 - 80\%\) | High energy consumption in thermal reactors | Halogen catalyst poisoning; toxic tar formation | Petrochemical refineries accept secondary pyrolysis oils |
| Industrial Waste Heat Cascading | Rankine cycles, steam networks, absorption chilling | Recovers \(30 - 55\%\) enthalpy from exhaust gases | Eliminates fossil boiler loads in adjacent plants | Thermal pinch mismatches; pipeline heat loss beyond \(3\text{ km}\) | Power plant steam powers biotech & district heating |
| Zero Liquid Discharge (ZLD) | Reverse osmosis, brine concentrators, crystallization | Water recovery \(\gt 95\%\); crystallizes pure salts | Intensive electrical/steam draw (\(15 - 35\text{ kWh/m}^3\)) | Membrane scaling; disposal liability of mixed solid salt cake | Textile wastewater provides cooling water for power plants |
| Anaerobic Digestion & Bio-Nutrient Loops | Methanogenic microbial digestion of organic slurries | Biomethane yield \(0.35 - 0.50\text{ m}^3\text{/kg VS}\); digestate | Displaces synthetic nitrogen Haber-Bosch fertilizers | Ammonia inhibition; volatile fatty acid souring | Food waste digestate enriches peri-urban agriculture |
Core Concepts in Circular Economy
Principles of Circular Economy
The circular economy offers a regenerative system where products, components, and materials maintain their highest utility and value at all times. It is structured upon three foundational principles:
- Design Out Waste and Pollution: Preventing waste at the blueprint stage by selecting non-toxic materials, avoiding irreversible chemical composites, and engineering mono-material packaging for seamless recyclability.
- Keep Products and Materials in Use: Maximizing asset utilization through repair, refurbishment, remanufacturing, and Product-as-a-Service (PaaS) business frameworks that incentivize manufacturers to design for extreme durability.
- Regenerate Natural Systems: Moving beyond harm reduction to restore ecological capital, returning clean biological nutrients to the biosphere through composting, agroforestry, and non-toxic bio-based inputs.
Circular Design Strategies
- Cradle-to-Cradle Design: Differentiating all materials into strictly segregated biological nutrients (biodegradable without ecotoxicity) and technical nutrients (perpetually circular without downcycling).
- Design for Disassembly (DfD): Utilizing mechanical snap-fits and standardized fasteners rather than permanent chemical adhesives, allowing rapid disassembly at end-of-life.
- Biomimicry: Emulating natural metabolic pathways to design multi-functional industrial systems, such as passive cooling channels and non-toxic structural colorants.
Resource Loops
- Technical Loop: Inorganic materials (alloys, polymers, glass) circulate through repair, remanufacture, and high-efficiency closed-loop recycling without loss of structural properties.
- Biological Loop: Organic feedstocks safely re-enter the biosphere via anaerobic digestion and composting, regenerating topsoils and generating renewable biogas.
Case Studies in Industrial Ecology and Circular Economy
Kalundborg Eco-Industrial Park, Denmark
Kalundborg is the premier global benchmark of industrial symbiosis, where power plants, pharmaceutical facilities, oil refineries, and municipal utilities exchange waste heat, process steam, gypsum, and biological sludge.
- By-Product Synergy: Flue-gas desulfurization gypsum from the power station replaces mined virgin gypsum in a neighboring plasterboard plant.
- Enthalpy Cascading: High-pressure power plant steam supplies district heating to the city of Kalundborg and industrial heat to Novo Nordisk fermentation facilities, eliminating dedicated oil-fired boilers.
Ellen MacArthur Foundation Global Initiatives
The Ellen MacArthur Foundation drives cross-sector alignment through the New Plastics Economy global commitment, setting statutory targets for 100% reusable, recyclable, or compostable consumer packaging.
Closed-Loop Recycling in the Automotive Industry
- Automakers operate closed-loop aluminum stamping loops where post-industrial stamping scrap is immediately segregated by alloy grade, remelted, and re-rolled into automotive skin panels with a 95% energy reduction.
- Electric vehicle battery recycling lines recover up to 95% of active cathode metals (lithium, cobalt, nickel) via hydrometallurgical extraction to resupply gigafactories.
Why Study Industrial Ecology and Circular Economy
Systems Optimization & Industrial Metabolism
Students learn to map mass and energy balances across industrial sectors, eliminating structural inefficiencies through Material Flow Analysis and exergy accounting.
Life Cycle Assessment (LCA) Mastery
Engineers gain hands-on training with ISO 14040/44 computational modeling (OpenLCA, SimaPro) to quantify global warming potential, cumulative energy demand, and eco-toxicity across global value chains.
Circular Product Architecture
Coursework covers design for disassembly, material passports, reverse logistics network design, and Product-as-a-Service business models.
Cross-Sector Industrial Symbiosis
Students explore the spatial, economic, and logistical factors required to establish eco-industrial parks that turn industrial waste into valuable feedstocks.
Industrial Ecology and Circular Economy: Conclusion
Industrial ecology and the circular economy represent essential paradigms for reconciling modern industrial manufacturing with ecological limits. By shifting from linear extraction to closed metabolic loops, industries eliminate waste, insulate supply chains from resource volatility, and drive deep decarbonization. As digital product passports, automated optical sorting, and industrial symbiosis networks expand globally, circular engineering provides the definitive technical roadmap toward regenerative prosperity.
Frequently Asked Questions
What does “industrial ecology” mean in practice?
Industrial ecology models industrial networks after biological ecosystems. Instead of treating waste as an end-of-pipe disposal liability, it identifies adjacent processes where by-products, waste heat, and effluents can serve as secondary feedstocks, closing material and energy loops.
How is a circular economy different from conventional recycling?
Conventional recycling focuses on treating waste at the end of a linear product lifecycle, often resulting in downcycled materials with degraded physical properties. A circular economy redesigns products and business models from inception to retain maximum utility and purity through modularity, remanufacturing, and closed-loop cycles.
What is the role of Material Flow Analysis (MFA) in industrial systems?
MFA is an analytical accounting method based on the conservation of mass. It quantifies all material inputs, internal stocks, and outputs across a defined spatial-temporal boundary, exposing hidden leaks, unrecovered scrap, and points of environmental loss.
Practice & Assessment Module
Section 1: Interactive Foundational Concept Reviews
Question 1: Industrial Park Reinterpretation as an Ecosystem
Question 2: Linear vs. Circular Economy in Engineering Practice
Question 3: Combined Application of LCA and MFA
Question 4: Role of Renewable Energy in Circular Manufacturing
Section 2: Analytical & Scenario-Based Inquiry
Question 1: Urban Metabolism & Circular Infrastructure
Question 2: Product-as-a-Service (PaaS) Workflow Transformation
Question 3: IoT & Blockchain in Reverse Logistics
Section 3: Numerical & Quantitative Engineering Problems
Problem 1: Steel Manufacturing Material Recovery Rate (MRR)
Question: A manufacturing facility processes \(50,000.0\text{ tons}\) of raw steel annually. Through internal process optimization, \(8,500.0\text{ tons}\) of scrap steel are recycled internally, and \(4,000.0\text{ tons}\) are exchanged via industrial symbiosis. Calculate the overall Material Recovery Rate (MRR) percentage.
Solution:
1. Total recovered steel: \(8,500.0 + 4,000.0 = 12,500.0\text{ tons}\)
2. Material Recovery Rate calculation:
$$\text{MRR} = \left(\frac{\text{Total Recovered Material}}{\text{Total Raw Material Input}}\right) \times 100\% = \left(\frac{12,500.0}{50,000.0}\right) \times 100\% = \mathbf{25.0\%}$$Problem 2: Industrial Waste Heat Steam Carbon Offset
Question: A paper processing mill recovers \(45,000.0\text{ GJ/year}\) of waste heat steam to displace an onsite natural gas boiler. Natural gas combustion produces \(56.10\text{ kg CO}_2\text{/GJ}\). Calculate the net annual \(\text{CO}_2\) emissions avoided in metric tons.
Solution:
1. Total \(\text{CO}_2\) avoided in kilograms: \(45,000.0\text{ GJ} \times 56.10\text{ kg CO}_2\text{/GJ} = 2,524,500.0\text{ kg CO}_2\)
2. Convert to metric tons:
$$\Delta M_{\text{CO}_2} = \frac{2,524,500.0}{1,000.0} = \mathbf{2,524.50\text{ metric tons CO}_2\text{/year}}$$Problem 3: Primary vs. Secondary Aluminum Exergy Savings
Question: Producing primary aluminum requires \(170.0\text{ MJ/kg}\) of energy, while secondary recycled aluminum requires \(10.0\text{ MJ/kg}\). An automotive stamping facility substitutes \(1,200.0\text{ metric tons}\) of primary aluminum with secondary recycled alloy. Calculate total energy saved in Gigajoules (\(\text{GJ}\)).
Solution:
1. Specific energy reduction: \(170.0 - 10.0 = 160.0\text{ MJ/kg}\)
2. Mass in kilograms: \(1,200.0\text{ t} \times 1,000.0 = 1,200,000.0\text{ kg}\)
3. Total energy saved:
$$E_{\text{saved}} = 1,200,000.0\text{ kg} \times 160.0\text{ MJ/kg} = 192,000,000.0\text{ MJ} = \mathbf{192,000.0\text{ GJ}}$$Problem 4: Anaerobic Digester Methane Yield Calculation
Question: An eco-park organic digestor receives \(15,000.0\text{ wet tons/year}\) of food waste with a volatile solids (\(\text{VS}\)) content of \(20.0\%\). If the specific biomethane yield is \(0.40\text{ m}^3\text{ CH}_4\text{/kg VS}\), calculate total annual methane production in cubic meters.
Solution:
1. Volatile solids mass: \(15,000.0\text{ t} \times 0.20 = 3,000.0\text{ dry tons} = 3,000,000.0\text{ kg VS}\)
2. Annual methane output:
$$V_{\text{CH}_4} = 3,000,000.0\text{ kg VS} \times 0.40\text{ m}^3\text{/kg VS} = \mathbf{1,200,000.0\text{ m}^3\text{ CH}_4\text{/year}}$$Problem 5: Product-as-a-Service (PaaS) Asset Demand Reduction
Question: An electronics manufacturer transitions from selling laptops with an average lifespan of \(3.0\text{ years}\) to a leasing service that refurbishes units, extending active lifespan to \(6.0\text{ years}\). For a client base requiring \(60,000\text{ active units}\) continuously, calculate the annual reduction in units manufactured.
Solution:
1. Baseline sales annual production: \(\frac{60,000}{3.0} = 20,000\text{ units/year}\)
2. PaaS leasing annual production: \(\frac{60,000}{6.0} = 10,000\text{ units/year}\)
3. Net reduction in annual unit production:
$$\Delta N = 20,000 - 10,000 = \mathbf{10,000\text{ units/year}}\quad (50.0\%\text{ reduction})$$Problem 6: Zero Liquid Discharge (ZLD) Economic Feasibility
Question: A textile finishing facility consumes \(500,000.0\text{ m}^3\text{/year}\) of water at \(\$2.20\text{/m}^3\) and pays \(\$1.80\text{/m}^3\) for discharge surcharges. Installing a membrane ZLD loop recovers \(85.0\%\) of water for reuse at an operational cost of \(\$1.10\text{/m}^3\). Determine net annual financial savings.
Solution:
1. Recycled volume: \(500,000.0 \times 0.85 = 425,000.0\text{ m}^3\text{/year}\)
2. Avoided freshwater purchase: \(425,000.0 \times \$2.20 = \$935,000.00\)
3. Avoided effluent surcharge: \(425,000.0 \times \$1.80 = \$765,000.00\)
4. Operating costs: \(425,000.0 \times \$1.10 = \$467,500.00\)
5. Net annual financial savings:
$$\text{Net Savings} = (\$935,000.00 + \$765,000.00) - \$467,500.00 = \mathbf{\$1,232,500.00\text{ / year}}$$Problem 7: Urban Mining Electronic Circuit Board Precious Metal Recovery
Question: Hydrometallurgical processing of \(1.00\text{ metric ton}\) of discarded printed circuit boards recovers \(250.0\text{ grams}\) of gold. At a gold price of \(\$65.00\text{/g}\) and refining costs of \(\$4,500.00\text{/ton}\), compute the net operating profit per ton of e-waste processed.
Solution:
1. Gross revenue per ton: \(250.0\text{ g} \times \$65.00\text{/g} = \$16,250.00\)
2. Net operating profit:
$$\text{Profit} = \$16,250.00 - \$4,500.00 = \mathbf{\$11,750.00\text{ / metric ton}}$$