
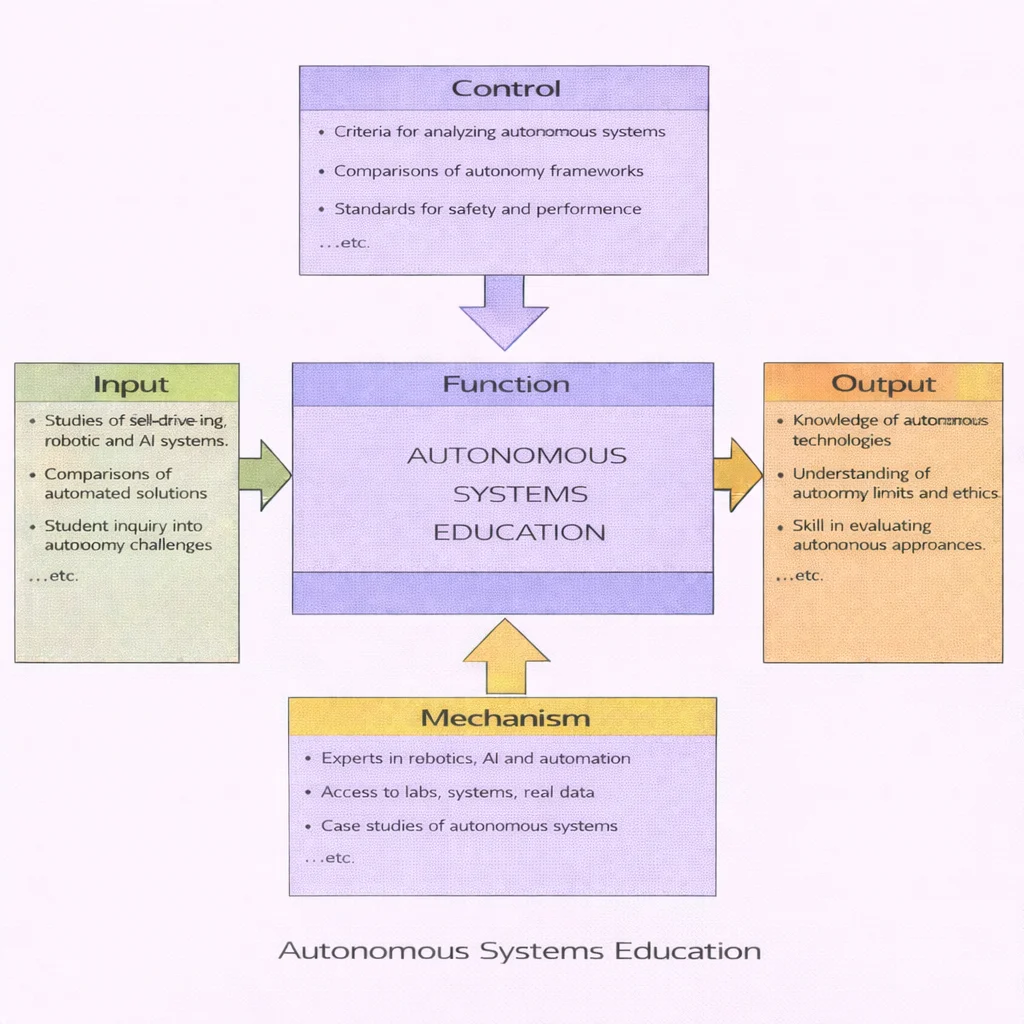
Autonomous systems education turns observational curiosity regarding self-driving platforms, robotics, and embodied artificial intelligence into disciplined engineering understanding. Students begin with empirical inputs: automated hardware demonstrations, industrial robotics workflows, and comparative multi-sensor analyses. Learning is governed by strict controls: systems-engineering criteria, safety verification frameworks, and formal performance benchmarks that prevent technology hype from displacing evidentiary rigor. Supported by laboratory testbeds, open telemetry datasets, and real-world case studies, learners acquire the capacity to evaluate what an autonomous system can execute, identify its operational boundaries, and critically evaluate its ethical limitations.
Autonomous systems are intelligent cyber-physical machines or software agents engineered to perceive dynamic unstructured environments, process context-aware information, formulate optimal plans, and execute physical or digital actions with minimal human oversight. By synthesizing advancements in artificial intelligence (AI) and machine learning (ML), robotics, computer vision, and feedback control systems, these platforms navigate real-world uncertainty. Applications span self-driving automobiles and unmanned aerial vehicles (UAVs) to robotic-assisted surgery, Industry 4.0 smart factories, and planetary exploration.
Core Curricular Objectives
- Deconstruct the closed-loop perception, decision-making, and actuation pipelines of autonomous architectures.
- Evaluate the performance trade-offs of sensor fusion across LiDAR, RADAR, computer vision, and ultrasonic arrays.
- Analyze state estimation, SLAM (Simultaneous Localization and Mapping), and non-holonomic kinematic motion control.
- Examine fail-safe certification standards, edge-case vulnerability distributions, and cybersecurity mitigations.
- Assess the ethical liability, societal governance, and regulatory frameworks (e.g., ISO 26262) shaping autonomous technology deployments.

Autonomous Systems: Foundational Overview
Autonomous systems bridge the digital and physical domains. Rather than relying on static pre-programmed routines, they operate dynamically by executing data-driven inferences in real time under physical laws. This requires close integration among linear algebra, multivariate calculus, Bayesian statistics, and data science pipelines.
Across modern infrastructure, autonomy operates at multiple scales. In manufacturing and logistics, autonomous mobile robots (AMRs) communicate over low-latency industrial network protocols within Smart Industry 4.0 facilities. In civil infrastructure, autonomous sensor arrays monitor environmental water basins and power grids, interfacing directly with Internet of Things (IoT) frameworks.

From Intelligent Systems to Quantum Frontiers
Explore how autonomous architectures connect with frontier domains across the Prep4Uni Emerging Technologies curriculum:
Closed-loop sensing, multi-sensor perception fusion, real-time trajectory planning, and actuator feedback control.
Robotic deep-space navigation, terrain-relative landing, and life support systems under extreme orbital constraints.
Automated liquid handling, microfluidic cell sorting, and autonomous bioreactor control for therapeutic synthesis.
Quantum annealing and gate compilation accelerating high-dimensional optimization for autonomous fleet routing.
Core Operational Loop of Autonomous Architecture
Autonomous systems execute a continuous five-stage loop: sensing, data transformation, real-time decision-making, adaptive learning, and physical action execution:
1. Sensing & Perception Infrastructure
An autonomous agent interacts with its surroundings via proprioceptive (internal state) and exteroceptive (environmental state) sensors. Optical cameras yield rich semantic context, Light Detection and Ranging (LiDAR) provides precise 3D spatial point clouds, and radio detection and ranging (RADAR) measures Doppler velocity shifts under heavy atmospheric attenuation. Advanced perception algorithms classify objects and estimate velocity vectors using deep convolutional networks and vision transformers.

2. Edge Data Processing & State Estimation
Raw telemetry is subject to environmental noise, multipath reflections, and transmission jitter. Onboard edge computing clusters (combining multi-core CPUs, GPUs, and neural accelerators) execute real-time sensor fusion via Extended Kalman Filters (EKF) and factor graph optimizers. This computes a unified state vector: $$\mathbf{x}_t = [p_x, p_y, p_z, v_x, v_y, v_z, \phi, \theta, \psi]^T$$ representing position, linear velocity, and angular orientation.
3. Real-Time Decision-Making & Path Planning
Trajectory planning algorithms evaluate environmental models to generate collision-free paths. Hierarchical architectures separate global routing (e.g., A* or Dijkstra search over graph networks) from local trajectory generation (e.g., Model Predictive Control (MPC) and Rapidly-exploring Random Trees (RRT*)). Path generation operates under strict non-holonomic kinematic and dynamic friction constraints.
4. Self-Adaptation & Fleet Learning
Adaptive systems dynamically update control parameters when environmental dynamics shift (such as wheel traction loss on wet asphalt). Machine learning models continuously log anomaly events to retrain inference models via federated fleet learning, deploying optimized weights back to edge agents via secure over-the-air (OTA) updates.
5. Actuator Execution & Feedback Control
Digital control commands are converted into physical forces by high-torque brushless DC motors, hydraulic valves, and servo actuators. Closed-loop PID and feedforward controllers continuously compare measured output states against planned trajectories, dynamically correcting tracking errors.
In-Depth Case Studies: Autonomy in Action
Case Study 1: Commercial Automotive Autonomy — Tesla Vision & Fleet Learning
Tesla’s approach to consumer automated driving emphasizes a pure-vision architecture, relying on eight external CMOS cameras and onboard neural networks rather than high-definition LiDAR mapping. The vision pipeline processes multi-camera video streams through a spatial-temporal neural network that directly outputs 3D vector occupancy grids.

Operating at SAE Level 2, the vehicle continuously runs driver-monitoring systems (via cabin infrared cameras and steering wheel torque sensors) to verify driver engagement. Edge cases and near-miss disengagements are uploaded back to central GPU clusters for automatic model retraining.
Case Study 2: High-Altitude Long-Endurance Aerospace — The MQ-9 Reaper
The General Atomics MQ-9 Reaper unmanned aerial vehicle (UAV) provides persistent intelligence, surveillance, and reconnaissance (ISR). Equipped with the Multi-Spectral Targeting System (MTS-B), synthetic aperture radar (SAR), and beyond-line-of-sight satellite communications (SATCOM), the platform operates at altitudes up to 50,000 feet for over 27 continuous hours.

The aircraft uses autonomous waypoint tracking, emergency return-to-base (RTB) logic upon link loss, and automated takeoff and landing systems (ATLS), while human operators retain strict control over weapons deployment.
Case Study 3: Extraterrestrial Planetary Robotics — NASA’s Perseverance Rover
Operating in Mars’s Jezero Crater, NASA’s Perseverance rover navigates an environment where radio signals take between 5 and 20 minutes to reach Earth, making real-time human control impossible. Autonomy is therefore mission-critical.

Perseverance uses Terrain-Relative Navigation (TRN) to match descent imagery against orbital maps for safe touch-down, and the AutoNav pipeline to compute hazard-free paths in real time across Martian terrain.
Interactive Autonomous Stopping Distance Simulator
Simulate perception latency, compute overhead, and tire-road friction to analyze their impact on total autonomous stopping distances:
Frequently Asked Questions on Autonomous Systems
1. What is the fundamental difference between automated systems and autonomous systems?
Automated systems execute fixed, pre-programmed instruction sequences within structured, controlled environments (such as a factory robotic arm following fixed coordinates). Autonomous systems adapt dynamically within unstructured, uncertain environments by interpreting real-time sensor telemetry and generating appropriate actions without human intervention.
2. Why is multi-sensor fusion mandatory for safety-critical autonomous platforms?
No individual sensor provides complete environmental awareness across all operating conditions. Optical cameras offer high-resolution semantic classification but degrade in direct glare or heavy fog; LiDAR produces precise 3D geometric point clouds but suffers attenuation in rain and snow; radar provides robust velocity data through precipitation but lacks spatial resolution. Sensor fusion combines these data streams to create an accurate, redundant environmental model.
3. What role does edge computing play in mobile robotics and aerial drones?
Edge computing allows deep learning inference and trajectory planning to run locally on onboard silicon (e.g., embedded GPUs and TPUs). This removes dependencies on cloud connections, avoiding latency delays and communication dropouts that could lead to high-speed collisions.
End-of-Page Comprehensive Practice Module
Part I: Interactive Conceptual Review
1. How does autonomous driving differ fundamentally from traditional adaptive cruise control (ACC)?
2. Which sensors are required for an autonomous delivery drone during vertical touchdown?
3. Why do Autonomous Underwater Vehicles (AUVs) combine acoustic sonar with Doppler Velocity Logs (DVL)?
Part II: Analytical & Scenario-Based Inquiry
1. What failure modes threaten safety-critical autonomous systems during distribution shifts?
2. How do cybersecurity attack vectors threaten autonomous vehicle fleets?
Part III: Step-by-Step Quantitative Engineering Computations
Problem 1: Autonomous UAV Flight Time Under Headwind Constraints
Scenario: An autonomous delivery drone navigates a straight flight corridor of total distance \(D = 500.0 \text{ m}\). Its nominal cruising speed is \(v_0 = 10.0 \text{ m}\cdot\text{s}^{-1}\). For \(50.0\%\) of the path, a strong localized headwind reduces its ground speed by \(20.0\%\). Determine the total transit time.
Step-by-Step Derivation:
$$ \begin{aligned} d_1 = d_2 &= \frac{500.0 \text{ m}}{2} = 250.0 \text{ m} \\ v_{\text{wind}} &= v_0 \times (1 - 0.20) = 10.0 \times 0.80 = 8.0 \text{ m}\cdot\text{s}^{-1} \\ t_1 &= \frac{d_1}{v_0} = \frac{250.0 \text{ m}}{10.0 \text{ m}\cdot\text{s}^{-1}} = 25.0 \text{ s} \\ t_2 &= \frac{d_2}{v_{\text{wind}}} = \frac{250.0 \text{ m}}{8.0 \text{ m}\cdot\text{s}^{-1}} = 31.25 \text{ s} \\ t_{\text{total}} &= t_1 + t_2 = 25.0 \text{ s} + 31.25 \text{ s} = 56.25 \text{ s} \end{aligned} $$Answer & Conclusion: The drone completes the route in exactly \(56.25 \text{ seconds}\).
Problem 2: Mobile Robot Sensor Polling and Mission Duration
Scenario: A warehouse AMR samples its distance sensors every \(\Delta t = 0.50 \text{ s}\). If the robot completes \(N = 240\) discrete sampling steps while navigating an aisle, calculate the total traversal time in seconds and minutes.
Step-by-Step Derivation:
$$ \begin{aligned} T &= N \times \Delta t = 240 \times 0.50 \text{ s} = 120.0 \text{ s} \\ T_{\text{min}} &= \frac{120.0 \text{ s}}{60 \text{ s/min}} = 2.0 \text{ minutes} \end{aligned} $$Answer & Conclusion: Total mission duration equals \(120.0 \text{ seconds}\) (or \(2.0 \text{ minutes}\)).
Problem 3: Sensor Fusion Accuracy Improvement
Scenario: An optical sensor system classifies \(1{,}000\) track objects with a baseline accuracy of \(98.0\%\). An algorithmic update increases accuracy by \(1.5\%\) absolute. Calculate the number of correct classifications before and after the update.
Step-by-Step Derivation:
$$ \begin{aligned} C_{\text{initial}} &= 1{,}000 \times 0.980 = 980 \text{ correct readings} \\ A_{\text{new}} &= 98.0\% + 1.5\% = 99.5\% \\ C_{\text{updated}} &= 1{,}000 \times 0.995 = 995 \text{ correct readings} \end{aligned} $$Answer & Conclusion: Correct classifications increase from 980 to 995, reducing incorrect readings from 20 to 5.
Problem 4: Autonomous Vehicle Travel Time Under Traffic Deceleration
Scenario: An autonomous shuttle travels \(D = 80.0 \text{ km}\) with an initial baseline travel time of \(t_0 = 1.50 \text{ hours}\). Heavy traffic reduces average speed by \(30.0\%\). Determine the new travel time in hours and minutes.
Step-by-Step Derivation:
$$ \begin{aligned} v_0 &= \frac{D}{t_0} = \frac{80.0 \text{ km}}{1.50 \text{ h}} \approx 53.33 \text{ km}\cdot\text{h}^{-1} \\ v_{\text{traffic}} &= v_0 \times (1 - 0.30) = 53.33 \times 0.70 \approx 37.33 \text{ km}\cdot\text{h}^{-1} \\ t_{\text{new}} &= \frac{D}{v_{\text{traffic}}} = \frac{80.0 \text{ km}}{37.33 \text{ km}\cdot\text{h}^{-1}} \approx 2.143 \text{ hours} \\ \text{Minutes} &= 0.143 \times 60 \approx 8.57 \text{ min} \approx 8 \text{ min } 34 \text{ s} \end{aligned} $$Answer & Conclusion: Travel time increases to approximately \(2.14 \text{ hours}\) (or 2 hours, 8 minutes, and 34 seconds).
Problem 5: Battery Longevity via Power Optimization
Scenario: A mobile surveillance robot runs for \(t_{\text{load}} = 4.0 \text{ hours}\) under full computational load. Engaging an edge power-optimization mode cuts compute draw by \(15.0\%\) and extends operating lifespan by \(25.0\%\). Calculate the new operating duration and the remaining compute profile.
Step-by-Step Derivation:
$$ \begin{aligned} t_{\text{extended}} &= 4.0 \text{ h} \times (1 + 0.25) = 4.0 \times 1.25 = 5.0 \text{ hours} \\ P_{\text{compute}} &= 100\% - 15.0\% = 85.0\% \end{aligned} $$Answer & Conclusion: Battery life extends to \(5.0 \text{ hours}\) while maintaining \(85.0\%\) of maximum compute capacity.
Problem 6: Delivery Fleet Trajectory Optimization
Scenario: A municipal fleet of \(N = 50\) autonomous delivery robots averages \(d_0 = 12.0 \text{ km}\cdot\text{day}^{-1}\) per unit. Graph-theoretic route optimization shortens daily routes by \(10.0\%\). Determine the new single-robot distance and total fleet distance per day.
Step-by-Step Derivation:
$$ \begin{aligned} d_{\text{robot}} &= 12.0 \text{ km} \times (1 - 0.10) = 12.0 \times 0.90 = 10.8 \text{ km}\cdot\text{day}^{-1} \\ D_{\text{fleet}} &= 50 \times 10.8 \text{ km} = 540.0 \text{ km}\cdot\text{day}^{-1} \end{aligned} $$Answer & Conclusion: Each robot travels \(10.8 \text{ km}\), reducing total daily fleet travel to \(540.0 \text{ km}\).
Problem 7: Obstacle Avoidance Success Rate Sizing
Scenario: An obstacle-avoidance algorithm achieves a \(95.0\%\) success rate across \(N = 80\) challenging maneuvers. A software update increases the success rate by \(3.0\%\) absolute. Calculate successful maneuvers before and after the update.
Step-by-Step Derivation:
$$ \begin{aligned} S_1 &= 80 \times 0.95 = 76 \text{ successful maneuvers} \\ R_2 &= 95.0\% + 3.0\% = 98.0\% \\ S_2 &= 80 \times 0.98 = 78.4 \rightarrow 78 \text{ fully completed maneuvers} \end{aligned} $$Answer & Conclusion: Successful maneuvers increase from 76 to 78 (or \(78.4\) expected successes).
Problem 8: Super-Resolution Camera Sensor Scaling
Scenario: A drone vision camera with native resolution of \(12.0 \text{ MP}\) implements a super-resolution model that increases effective pixel clarity by \(20.0\%\). Calculate the new effective resolution and the net pixel gain.
Step-by-Step Derivation:
$$ \begin{aligned} P_{\text{new}} &= 12.0 \text{ MP} \times (1 + 0.20) = 12.0 \times 1.20 = 14.4 \text{ MP} \\ \Delta P &= 14.4 \text{ MP} - 12.0 \text{ MP} = 2.4 \text{ MP} \end{aligned} $$Answer & Conclusion: Effective resolution increases to \(14.4 \text{ MP}\), a net gain of \(2.4 \text{ MP}\).
Problem 9: Automated Assembly Line Shift Throughput
Scenario: An industrial robotic workcell processes \(300 \text{ units/h}\). During an 8.0-hour shift, maintenance recalibration reduces throughput by \(12.0\%\) for \(30.0 \text{ minutes}\) every \(4.0 \text{ hours}\) (total maintenance: \(1.0 \text{ hour}\)). Calculate total units assembled during the shift.
Step-by-Step Derivation:
$$ \begin{aligned} t_{\text{normal}} &= 8.0 \text{ h} - 1.0 \text{ h} = 7.0 \text{ h} \\ t_{\text{maint}} &= 1.0 \text{ h} \\ R_{\text{maint}} &= 300 \text{ units/h} \times (1 - 0.12) = 300 \times 0.88 = 264 \text{ units/h} \\ U_{\text{normal}} &= 7.0 \text{ h} \times 300 \text{ units/h} = 2{,}100 \text{ units} \\ U_{\text{maint}} &= 1.0 \text{ h} \times 264 \text{ units/h} = 264 \text{ units} \\ U_{\text{total}} &= 2{,}100 + 264 = 2{,}364 \text{ units} \end{aligned} $$Answer & Conclusion: The workcell produces \(2{,}364 \text{ units}\) across the shift.
Problem 10: High-Speed LiDAR Rotational Scans Over Distance
Scenario: A vehicle LiDAR unit operates at a scan rate of \(f = 15.0 \text{ Hz}\) (\(15 \text{ scans/s}\)). The autonomous test car travels \(D = 2.0 \text{ km}\) (\(2{,}000.0 \text{ m}\)) at a constant speed of \(v = 20.0 \text{ m}\cdot\text{s}^{-1}\). Calculate total completed scans.
Step-by-Step Derivation:
$$ \begin{aligned} t_{\text{travel}} &= \frac{D}{v} = \frac{2{,}000.0 \text{ m}}{20.0 \text{ m}\cdot\text{s}^{-1}} = 100.0 \text{ s} \\ N_{\text{scans}} &= t_{\text{travel}} \times f = 100.0 \text{ s} \times 15.0 \text{ scans}\cdot\text{s}^{-1} = 1{,}500 \text{ scans} \end{aligned} $$Answer & Conclusion: The LiDAR system completes \(1{,}500 \text{ complete scans}\) over the distance.
Problem 11: Subsea Telemetry Rate and Bandwidth Expansion
Scenario: An Autonomous Underwater Vehicle (AUV) records sonar data at \(R_0 = 5.0 \text{ MB}\cdot\text{min}^{-1}\) during a \(60.0\text{-minute}\) dive. An updated acoustic array increases data throughput by \(40.0\%\) and extends dive time to \(80.0 \text{ minutes}\). Compare total data gathered.
Step-by-Step Derivation:
$$ \begin{aligned} \text{Data}_{\text{orig}} &= 5.0 \text{ MB/min} \times 60.0 \text{ min} = 300.0 \text{ MB} \\ R_{\text{new}} &= 5.0 \text{ MB/min} \times (1 + 0.40) = 5.0 \times 1.40 = 7.0 \text{ MB/min} \\ \text{Data}_{\text{new}} &= 7.0 \text{ MB/min} \times 80.0 \text{ min} = 560.0 \text{ MB} \\ \Delta \text{Data} &= 560.0 \text{ MB} - 300.0 \text{ MB} = 260.0 \text{ MB} \end{aligned} $$Answer & Conclusion: Total data increases from \(300.0 \text{ MB}\) to \(560.0 \text{ MB}\), an increase of \(86.7\%\).
Problem 12: Sensor Error Reduction Through Hardware Calibration
Scenario: An ultrasonic proximity sensor has an initial false-positive error rate of \(8.0\%\). A hardware recalibration reduces the error rate by \(25.0\%\) relative. For \(2{,}000\) sample readings, calculate total errors before and after calibration.
Step-by-Step Derivation:
$$ \begin{aligned} E_{\text{initial}} &= 2{,}000 \times 0.080 = 160 \text{ errors} \\ \text{Rate}_{\text{new}} &= 8.0\% \times (1 - 0.25) = 8.0\% \times 0.75 = 6.0\% \\ E_{\text{updated}} &= 2{,}000 \times 0.060 = 120 \text{ errors} \\ \Delta E &= 160 - 120 = 40 \text{ fewer errors} \end{aligned} $$Answer & Conclusion: False readings decrease from 160 down to 120, eliminating 40 false triggers.
Autonomous Systems: Summary & Learning Wrap-Up
Autonomous systems represent the integration of machine learning, control theory, multi-modal perception, and real-time edge processing. Whether navigating Mars’s Jezero Crater, operating in automated warehouses, or assisting in surgical operating rooms, these cyber-physical architectures rely on closed-loop feedback and formal safety bounds. Mastering autonomous systems equips students with the cross-disciplinary skills required to design, test, and deploy dependable intelligent platforms.