Domain-specific Analytics Education is where analytics stops being a universal toolbox and becomes a craft shaped by context. The diagram places that craft at the center: inputs—materials and prior knowledge—enter the learning process, but they are not allowed to roam freely. Controls such as domain ethics and specialized policies act like a compass and a boundary line at once, steering learners toward questions that matter and away from shortcuts that would be misleading or unacceptable in that particular profession. Mechanisms—expert instruction, industry tools, and real domain data—then give students a place to practice the subtle work: choosing metrics that make sense in the field, interpreting patterns without forgetting operational realities, and translating results into decisions that stakeholders can actually use. The output is not “analysis in general,” but contextual analysis—insight that carries the accent of its domain, understands its constraints, and earns trust because it respects the rules of the world it aims to explain.
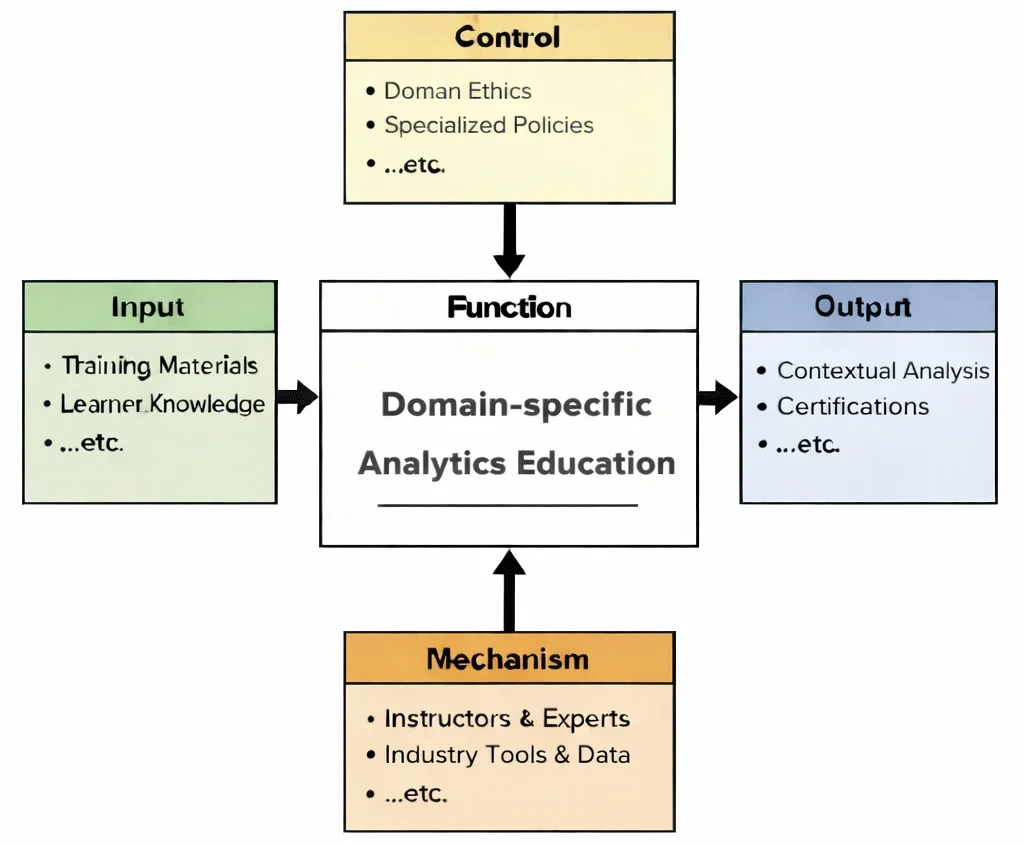
This IDEF0 (Input–Control–Output–Mechanism) diagram summarizes Domain-specific Analytics Education as a structured transformation. Inputs include training materials and learner knowledge. Controls include domain ethics and specialized policies that define what questions may be asked, what data may be used, and what “good evidence” means in that field. Mechanisms include instructors and experts plus industry tools and domain datasets that enable realistic practice. Outputs include contextual analysis and demonstrable competency (such as certifications or project outcomes), reflecting the learner’s ability to interpret data with domain meaning rather than generic technique.
Domain-specific analytics brings precision and contextual depth to data interpretation by tailoring analytical approaches to the needs of particular industries or sectors. Unlike general-purpose analytics, which provides broad insights, domain-specific applications integrate unique variables, workflows, and regulatory contexts. Whether you’re investigating patient outcomes in healthcare or analyzing fraud detection in finance, domain knowledge amplifies the power of data science and analytics.
To build effective solutions, analysts begin with high-quality data. This involves rigorous data cleaning and preprocessing and appropriate data collection and storage strategies. Depending on the field, domain-specific data might include electronic health records, network logs, industrial sensor outputs, or financial transactions. The ability to process and prepare such data is foundational to every project.
Domain-specific approaches benefit from the techniques developed for data analysis and big data analytics, but they go further by incorporating expert heuristics and industry standards. For instance, in cybersecurity, visualizing anomalies using data visualization tools can help analysts rapidly detect emerging threats. Similarly, in manufacturing, predictive models informed by domain metrics can prevent costly downtime.
The tools that enable such precision are highlighted under tools and technologies in data science. These range from domain-specific databases to specialized libraries and frameworks that adapt to sector-specific formats and algorithms. Integration with real-time systems or embedded analytics platforms is often critical, especially in fields like CPS security and operational technology (OT) security.
Ethical considerations also come to the fore when analytics intersects with human behavior. In sectors such as education, law enforcement, or healthcare, respecting ethical and social aspects is non-negotiable. Moreover, professionals must ensure alignment with standards outlined in cybersecurity policy and data governance frameworks to maintain public trust.
Domain-specific analytics also intersects with developments in cybersecurity and emerging areas in cybersecurity. For example, in smart grid monitoring, data from cloud security and endpoint security is used to create domain-specific risk profiles. Likewise, in identity management, domain-relevant insights enhance identity and access management protocols.
AI-enabled insights are further amplified in contexts such as AI and ML in cybersecurity, where machine learning models are trained on specific domain data to classify anomalies, anticipate breaches, or optimize resource use. These efforts are frequently supported by frameworks in incident response and forensics and threat intelligence.
Additionally, sectors like banking and healthcare benefit from secure data environments shaped by expertise in cryptography and application security. Understanding both the technical and human dimensions is essential, whether you’re training models, detecting fraud, or improving ethical hacking protocols.
In sum, domain-specific analytics serves as the bridge between generalized theory and actionable, industry-focused insight. It equips professionals with the tools to not only interpret data but also to shape policies, innovate practices, and improve outcomes tailored to their unique contexts.

This image portrays domain-specific analytics as a shared core of data science adapted to different real-world contexts. At the center, a radiant “data hub” sphere suggests a common analytical foundation—statistics, models, and computation—while the surrounding icons (medical symbol, currency sign, vehicles, lab/science motifs, cloud and security elements) represent specialized domains with their own constraints, terminology, and success metrics. The analysts positioned around the hub imply that insights are built through interpretation, not just calculation: each domain requires understanding what the data truly means, what risks matter, and what decisions are being supported. The charts and dashboards emphasize measurement and communication, while the diverse symbols highlight the main idea: the best analytics is not generic—it is shaped by the goals, rules, and realities of the field where it is applied.
Table of Contents
Healthcare Analytics
Healthcare analytics uses data-driven approaches to improve patient outcomes, operational efficiency, and decision-making in the healthcare sector.
Key Applications:
- Predictive Modeling for Patient Outcomes:
- Uses historical patient data to forecast outcomes such as disease progression, treatment success, or hospital readmission.
- Example: Predicting the likelihood of heart disease based on a patient’s health history and lifestyle factors.
- Disease Diagnosis:
- Leveraging machine learning algorithms and medical imaging data to diagnose conditions like cancer, diabetes, or neurological disorders.
- Example: AI-driven tools like IBM Watson Health assist doctors in identifying and treating diseases.
- Hospital Management:
- Optimizing resource allocation, reducing patient wait times, and managing staff schedules using operational data.
- Example: Predicting peak patient flow times to enhance staffing and bed availability.
- Predictive Modeling for Patient Outcomes:
Tools:
- Electronic Health Records (EHR) Systems: Epic, Cerner.
- Data Analysis Tools: Python (SciPy, NumPy), R, Tableau.
Emerging Areas:
- Precision Medicine: Tailoring treatments to individual patients based on genetic and lifestyle data.
- Telemedicine Analytics: Monitoring patient health through wearable devices and remote consultations.
Financial Analytics
Financial analytics focuses on analyzing monetary data to optimize financial performance, manage risks, and detect fraudulent activities.
Key Applications:
- Fraud Detection:
- Real-time monitoring and analysis of transactions to identify unusual patterns or anomalies.
- Example: Credit card companies use machine learning models to flag suspicious purchases.
- Risk Assessment:
- Evaluating investment risks by analyzing market trends, historical data, and macroeconomic indicators.
- Example: Banks use risk models to determine the likelihood of loan defaults.
- Portfolio Optimization:
- Balancing assets in investment portfolios to maximize returns and minimize risks.
- Example: Hedge funds use quantitative analytics to design trading strategies.
- Fraud Detection:
Tools:
- Statistical Software: R, Python (Pandas, Matplotlib).
- Financial Platforms: Bloomberg Terminal, Reuters Eikon.
- Big Data Tools: Hadoop, Apache Spark.
Emerging Areas:
- Algorithmic Trading: Automating trading decisions based on market data.
- Cryptocurrency Analytics: Monitoring blockchain transactions and market trends.
Marketing Analytics
Marketing analytics uses data to measure campaign effectiveness, understand customer behavior, and optimize marketing strategies.
Key Applications:
- Customer Segmentation:
- Dividing customers into groups based on characteristics like demographics, purchasing behavior, or preferences.
- Example: E-commerce platforms use segmentation to recommend personalized products.
- Campaign Performance Analysis:
- Tracking metrics like click-through rates (CTR), conversion rates, and return on investment (ROI) to assess the effectiveness of marketing efforts.
- Example: Google Ads provides analytics on ad performance for better budget allocation.
- Customer Lifetime Value (CLV) Analysis:
- Estimating the total revenue a business can expect from a customer throughout their relationship.
- Example: Subscription services analyze CLV to tailor retention strategies.
- Customer Segmentation:
Tools:
- Marketing Platforms: Google Analytics, HubSpot.
- Data Visualization Tools: Tableau, Power BI.
- Customer Relationship Management (CRM): Salesforce.
Emerging Areas:
- Social Media Analytics: Tracking engagement and sentiment across platforms like Twitter and Instagram.
- Influencer Marketing Analytics: Measuring the impact of influencer campaigns on brand reach and sales.
Sports Analytics
Sports analytics applies data-driven techniques to optimize athlete performance, devise game strategies, and enhance fan engagement.
Key Applications:
- Performance Optimization:
- Monitoring metrics like speed, stamina, and injury risk to improve athlete training and reduce downtime.
- Example: Wearable sensors track players’ physiological data during training sessions.
- Game Strategy Analysis:
- Using historical game data to analyze opponent tactics and devise winning strategies.
- Example: Basketball teams use shot charts to evaluate player efficiency from different court areas.
- Fan Engagement:
- Analyzing fan preferences and behavior to enhance ticket sales and digital engagement.
- Example: Leveraging social media analytics to tailor promotional campaigns.
- Performance Optimization:
Tools:
- Sports Analytics Platforms: SAS Sports Analytics, SportVU.
- Wearables and IoT: Fitbit, Garmin.
- Video Analysis Tools: Hudl, Dartfish.
Emerging Areas:
- Esports Analytics: Tracking player performance and audience engagement in competitive gaming.
- Injury Prediction Models: Using AI to predict and prevent sports injuries.
How These Sub-Areas Interact
Healthcare Analytics
can use marketing analytics techniques for promoting wellness programs.
Financial Analytics
often overlaps with marketing analytics in customer segmentation and targeted promotions.
Sports Analytics
borrows predictive modeling from financial analytics to forecast game outcomes or player performance.
Why Study Domain-Specific Analytics
Applying Analytical Skills to Real-World Contexts
Understanding the Nuances of Industry-Specific Data
Improving Decision-Making in Targeted Applications
Building Interdisciplinary Thinking and Collaboration Skills
Preparing for Specialized Roles in a Data-Driven World
Domain-Specific Analytics – Frequently Asked Questions
These FAQs explain how data science methods are adapted to particular fields such as finance, healthcare, and manufacturing, and what students can do to build domain-aware analytics skills.
1. What is domain-specific analytics in data science?
Domain-specific analytics is the application of data science, statistics, and machine learning techniques within a particular field such as finance, healthcare, manufacturing, education, or sports. Instead of using generic models, analysts combine technical methods with deep subject knowledge so that data questions, metrics, and interpretations match the realities of that specific domain.
2. Why is domain knowledge important for analytics projects?
Domain knowledge is important because it helps analysts ask meaningful questions, choose relevant features, and interpret results correctly. Without understanding how a business, process, or system really works, even sophisticated models can be misleading. Domain expertise ensures that data definitions are correct, key constraints are respected, and recommendations are realistic and useful for decision-makers.
3. What are some examples of domain-specific analytics applications?
Examples of domain-specific analytics include credit risk scoring and fraud detection in finance, patient outcome prediction and hospital resource planning in healthcare, predictive maintenance and quality monitoring in manufacturing, adaptive learning analytics in education, and performance tracking in sports. Each example uses many of the same core techniques but customised metrics, data sources, and success criteria for that domain.
4. How does domain-specific analytics differ from general-purpose analytics?
General-purpose analytics focuses on methods and tools that can be applied anywhere, such as regression, clustering, or visualisation techniques. Domain-specific analytics still uses these tools, but adapts them to specialised data types, regulations, workflows, and performance measures. In practice this means different data pipelines, feature engineering choices, validation strategies, and ways of explaining results to stakeholders.
5. What kinds of data are used in domain-specific analytics?
Domain-specific analytics can use structured data such as transaction records, sensor readings, or medical codes, as well as unstructured data such as text notes, images, audio, and video. The exact data sources depend on the field. For example, healthcare analytics might rely on electronic health records, imaging, and lab results, while manufacturing analytics may depend more on IoT sensor streams, maintenance logs, and supply chain data.
6. Which skills are useful for a career in domain-specific analytics?
Useful skills include a solid foundation in statistics, data wrangling, and machine learning; experience with tools such as SQL, Python, or R; and strong data visualization and communication abilities. On top of this, students should build knowledge in at least one application area, learning its jargon, key metrics, common data sources, and regulatory or ethical constraints. The combination of technical and domain skills makes analysts more effective and employable.
7. What challenges arise when doing domain-specific analytics?
Challenges include dealing with messy or siloed data, aligning different systems that were not designed for analytics, and resolving conflicting definitions of key metrics. In regulated sectors, privacy and compliance rules may limit how data can be used. Another challenge is communicating results clearly to domain experts who may not be familiar with advanced models, while still respecting their practical experience and constraints.
8. How can students prepare to work in domain-specific analytics?
Students can prepare by learning core data science techniques and then choosing one or two domains to study more deeply. This might involve taking electives in finance, healthcare, engineering, or social sciences; reading case studies; analysing real-world datasets; and working on projects that mirror problems faced by organisations. Internships, capstone projects, and interdisciplinary teamwork are especially valuable for gaining domain-sensitive analytics experience.
Domain-Specific Analytics: Conclusion
Domain-specific analytics ensures that industry-specific challenges are met with tailored, data-driven solutions, fostering innovation and efficiency.
Domain-Specific Analytics: Review Questions and Answers:
1. What is domain-specific analytics and how does it differ from general analytics?
Answer: Domain-specific analytics focuses on applying data science and statistical methods to problems within a particular industry or field, such as healthcare, finance, or marketing. It differs from general analytics by leveraging specialized domain knowledge to interpret data in context, thereby producing more relevant and actionable insights. This tailored approach ensures that the analysis addresses industry-specific challenges and opportunities effectively. It also helps organizations make more informed decisions that align with their unique operational goals and regulatory environments.
2. How can industry-specific insights improve business strategy?
Answer: Industry-specific insights enable businesses to identify unique trends, customer behaviors, and competitive dynamics that are not evident in generic data analysis. By focusing on domain-specific data, organizations can tailor their strategies to better meet market demands and address specific operational challenges. These insights allow for the optimization of products, services, and marketing strategies, leading to improved customer satisfaction and increased profitability. Ultimately, leveraging specialized analytics provides a competitive advantage by aligning business decisions with the nuances of the target industry.
3. What are some common data sources used in domain-specific analytics?
Answer: Common data sources in domain-specific analytics include transactional databases, customer surveys, sensor data, industry reports, and social media feeds, among others. Each source provides unique insights that, when combined, offer a comprehensive view of industry trends and operational performance. These data sources are often heterogeneous and require specialized collection and preprocessing methods tailored to the specific industry. By integrating multiple sources, organizations can enrich their analyses and derive deeper, more accurate insights that drive strategic decision-making.
4. How does the integration of domain expertise enhance the effectiveness of analytics projects?
Answer: Integrating domain expertise into analytics projects ensures that data is interpreted within the correct industry context, leading to more accurate and actionable insights. Experts in the field can identify subtle trends, anomalies, and opportunities that purely technical analyses might overlook. Their insights help shape the analytical models and ensure that the results are relevant to real-world business challenges. This collaboration between data scientists and domain experts ultimately improves the quality of decision-making and aligns analytical outcomes with organizational goals.
5. What role do visualization tools play in communicating domain-specific insights?
Answer: Visualization tools are essential for communicating complex, domain-specific insights in a clear and engaging manner. They transform raw data and statistical outputs into intuitive graphs, charts, and dashboards that can be easily understood by both technical and non-technical stakeholders. By presenting data visually, organizations can highlight key trends, outliers, and patterns that inform strategic decisions. Effective visualizations also foster collaboration and help drive action by making it easier to share insights across different departments within an organization.
6. How can predictive analytics be tailored to specific industry requirements?
Answer: Predictive analytics can be tailored to specific industry requirements by incorporating domain-specific variables and contextual factors into the predictive models. This involves using historical data from the industry to train machine learning algorithms and adjust the model parameters to reflect industry trends and seasonal patterns. Customization might include integrating unique performance metrics, regulatory constraints, or customer behavior patterns that are critical to the sector. As a result, the predictions become more accurate and relevant, enabling businesses to anticipate market shifts and make informed decisions that align with their specific operational needs.
7. What challenges might arise when implementing domain-specific analytics projects?
Answer: Implementing domain-specific analytics projects often presents challenges such as data integration from diverse sources, ensuring data quality, and aligning analytical models with domain-specific needs. Organizations may face difficulties in obtaining clean, reliable data and in converting raw data into formats that are meaningful within a specific industry context. Additionally, the lack of in-house domain expertise can hinder the interpretation of complex analytics results. Overcoming these challenges typically requires robust data governance, collaboration with industry experts, and the use of advanced preprocessing and modeling techniques tailored to the domain.
8. How does domain-specific analytics contribute to competitive advantage?
Answer: Domain-specific analytics contributes to competitive advantage by providing tailored insights that enable organizations to fine-tune their strategies based on a deep understanding of industry trends and customer behaviors. This specialized approach helps companies identify niche opportunities, optimize their operations, and mitigate risks more effectively than competitors using generic analytics. By leveraging insights unique to their field, businesses can innovate, improve product offerings, and enhance customer satisfaction. The resulting strategic agility and enhanced operational performance ultimately lead to a stronger market position.
9. What is the importance of continuous data monitoring in domain-specific analytics?
Answer: Continuous data monitoring is crucial in domain-specific analytics because it ensures that the insights remain current and relevant in a rapidly changing industry environment. Regular monitoring allows organizations to detect emerging trends, anomalies, or shifts in market behavior as they happen, facilitating timely adjustments to strategies. This ongoing vigilance helps maintain the accuracy of predictive models and the effectiveness of decision-making processes. By continuously updating data inputs and analytical models, businesses can sustain a competitive edge and respond proactively to new challenges.
10. How do domain-specific analytics projects drive innovation within industries?
Answer: Domain-specific analytics projects drive innovation by uncovering hidden patterns and insights that can lead to the development of new products, services, and business models tailored to the unique challenges of an industry. By leveraging specialized data and predictive models, organizations can identify opportunities for optimization and growth that may not be apparent through traditional analysis. This focus on industry-specific data encourages experimentation and the application of advanced technologies such as machine learning and AI. The resulting innovations not only enhance operational efficiency but also help companies adapt to evolving market demands and maintain long-term competitiveness.
Domain-Specific Analytics: Thought-Provoking Questions and Answers
1. How might the convergence of traditional industry knowledge and advanced analytics reshape decision-making in specialized sectors?
Answer: The convergence of traditional industry knowledge and advanced analytics has the potential to reshape decision-making by combining the deep contextual understanding of domain experts with the predictive power of modern analytics tools. This synergy can uncover insights that are both data-driven and contextually relevant, allowing organizations to make decisions that are more aligned with the realities of their industry. When traditional expertise is integrated with advanced analytics, it not only validates the insights derived from the data but also refines them to suit industry-specific challenges and opportunities.
This integration can lead to more nuanced strategies that consider both quantitative metrics and qualitative insights. As a result, organizations may experience a significant improvement in their ability to predict market trends, optimize operations, and innovate within their sectors, ultimately leading to a sustainable competitive advantage.
2. What challenges might arise when attempting to standardize domain-specific analytics across multiple industries, and how can they be addressed?
Answer: Standardizing domain-specific analytics across multiple industries can be challenging due to the inherent differences in data types, regulatory environments, and business practices. Each industry has unique characteristics that influence the way data is collected, processed, and interpreted, making it difficult to develop a one-size-fits-all analytics framework. These differences can lead to issues in data integration, model accuracy, and the relevance of insights derived from standardized methods.
To address these challenges, organizations should develop flexible analytics frameworks that can be customized to the specific needs of each industry. This may involve creating modular systems where core analytical components are standardized while allowing for the integration of domain-specific variables and metrics. Collaboration with industry experts and the adoption of adaptive machine learning techniques can further ensure that the standardized framework remains relevant and effective across diverse sectors.
3. How can emerging trends in artificial intelligence enhance the precision of domain-specific analytics, and what implications does this have for industry innovation?
Answer: Emerging trends in artificial intelligence, such as deep learning and reinforcement learning, have the potential to significantly enhance the precision of domain-specific analytics by automating the detection of intricate patterns and anomalies in complex datasets. These AI techniques can process large volumes of data at unprecedented speeds, allowing for more accurate predictive models and real-time insights that are finely tuned to industry-specific variables. As a result, organizations can achieve higher accuracy in forecasting trends and identifying opportunities for innovation.
The implications for industry innovation are substantial, as improved precision in analytics can lead to the development of highly targeted strategies that drive operational efficiency and product development. With more reliable predictions, businesses can allocate resources more effectively, reduce risks, and introduce innovations that address specific market needs. This AI-driven precision not only boosts competitiveness but also fosters a culture of continuous improvement and technological advancement within industries.
4. In what ways can data visualization be tailored to effectively communicate domain-specific insights to diverse stakeholders?
Answer: Data visualization can be tailored to effectively communicate domain-specific insights by incorporating design elements and visual representations that resonate with the target audience’s background and needs. For example, in finance, visualizations may emphasize trends and patterns through time-series charts and candlestick graphs, while in healthcare, dashboards might focus on patient outcomes and clinical performance metrics using heat maps and scatter plots. Customizing visual elements such as color schemes, annotations, and interactive features ensures that the data is not only accessible but also actionable for various stakeholders.
Furthermore, employing user-centric design principles and iterative feedback loops can help refine the visualizations to better meet the communication needs of both technical experts and non-technical decision-makers. By integrating contextual information and storytelling techniques, organizations can create compelling visual narratives that enhance understanding and foster informed decision-making across different departments.
5. How might the increasing availability of real-time data streams influence the development of domain-specific analytics models?
Answer: The increasing availability of real-time data streams is poised to transform domain-specific analytics models by enabling them to incorporate up-to-date information and respond dynamically to changing conditions. Real-time data allows models to be continuously updated, improving the accuracy of predictions and the relevance of insights in fast-paced industries. This immediacy ensures that analytics remain reflective of current trends and can quickly alert organizations to emerging risks or opportunities, facilitating timely decision-making and operational adjustments.
The integration of real-time data also encourages the development of adaptive models that leverage machine learning algorithms capable of processing continuous streams of data. Such models can detect subtle shifts in patterns and adjust their forecasts accordingly, leading to more resilient and responsive analytics frameworks. As industries increasingly rely on real-time insights, the evolution of these models will be critical for maintaining competitive advantage and driving innovation.
6. What are the potential limitations of relying heavily on automated data collection and preprocessing, and how can these limitations be overcome?
Answer: Relying heavily on automated data collection and preprocessing can introduce limitations such as the risk of propagating errors if the automation is not properly calibrated, as well as potential biases if the algorithms are not adequately supervised. Automated systems might also struggle with context-specific nuances that require human judgment, leading to incomplete or inaccurate data cleaning. These limitations can impact the quality of subsequent analysis and the reliability of the insights generated.
To overcome these challenges, organizations should adopt a hybrid approach that combines automated tools with human oversight. Regular audits, validations, and adjustments of automated processes can help ensure that they operate correctly and capture the necessary context. Investing in training for data scientists and analysts to monitor and refine automated workflows is also critical in maintaining high data quality and accurate preprocessing outcomes.
7. How can domain-specific analytics be integrated with business intelligence systems to drive strategic decision-making?
Answer: Domain-specific analytics can be integrated with business intelligence (BI) systems to provide a comprehensive view of both historical performance and predictive insights tailored to a particular industry. This integration allows decision-makers to access real-time dashboards that combine granular, domain-specific data with broader business metrics. By doing so, organizations can align their strategic objectives with operational realities, ensuring that decisions are informed by both qualitative and quantitative insights.
Moreover, the seamless integration of domain analytics with BI systems fosters a data-driven culture where insights are readily accessible to all stakeholders. This holistic approach enhances collaboration across departments, streamlines reporting processes, and ultimately drives more informed, agile decision-making that can adapt to market changes and industry trends.
8. How might advancements in natural language processing (NLP) impact the extraction of insights from unstructured domain-specific data?
Answer: Advancements in natural language processing (NLP) can significantly improve the extraction of insights from unstructured domain-specific data, such as customer reviews, clinical notes, or financial news articles. NLP algorithms are increasingly capable of understanding context, sentiment, and nuances in language, which allows them to convert unstructured text into structured data that can be analyzed quantitatively. This transformation enhances the ability to identify trends, measure sentiment, and uncover hidden patterns within large text corpora, providing deeper insights into customer behavior and market dynamics.
As NLP technology continues to evolve, it will facilitate more sophisticated analyses by enabling the automatic summarization, categorization, and translation of complex textual data. These capabilities not only improve the speed and efficiency of data processing but also ensure that critical insights are not lost in the noise of unstructured data. The enhanced extraction and analysis of textual data will empower organizations to make better-informed decisions based on a richer understanding of their domain-specific contexts.
9. What role can user feedback play in refining data visualization techniques for domain-specific analytics?
Answer: User feedback plays a crucial role in refining data visualization techniques by providing direct insights into how well the visualizations communicate complex domain-specific information. Feedback from end-users, including both technical and non-technical stakeholders, can highlight areas where visualizations may be confusing, misleading, or overly complex. This iterative process allows data scientists and visualization designers to adjust elements such as chart types, color schemes, and interactive features to better meet the needs of the audience.
By continuously collecting and integrating feedback, organizations can improve the clarity and effectiveness of their visualizations, ensuring that they support better decision-making and foster a deeper understanding of the underlying data. This user-centric approach ultimately enhances the overall impact of analytics by making insights more accessible and actionable across the organization.
10. How can businesses leverage data visualization to identify opportunities for innovation in domain-specific contexts?
Answer: Data visualization can be a powerful tool for identifying opportunities for innovation by revealing trends, patterns, and correlations that might be obscured in raw data. By presenting data in an intuitive, visual format, organizations can quickly spot emerging market trends, operational inefficiencies, and customer preferences that may signal untapped opportunities. Visualizations such as heat maps, scatter plots, and network diagrams can uncover complex relationships and dependencies within the data, prompting creative solutions and new business models.
Furthermore, interactive visualizations enable stakeholders to explore the data from multiple perspectives, facilitating brainstorming and collaborative problem-solving. This dynamic approach to data exploration not only drives innovation but also helps businesses stay agile and responsive in a competitive, rapidly changing landscape.
11. How might the integration of predictive analytics with domain-specific data visualization enhance forecasting accuracy?
Answer: Integrating predictive analytics with domain-specific data visualization enhances forecasting accuracy by combining robust statistical modeling with clear, actionable visual representations of future trends. Predictive models generate forecasts based on historical and real-time data, while advanced visualizations present these forecasts in an intuitive manner, making it easier for stakeholders to understand and act upon them. This integration allows decision-makers to quickly identify key drivers and potential risks, ensuring that forecasts are not only accurate but also practical and relevant to specific industry challenges.
Moreover, interactive dashboards that combine predictive analytics with visualization enable continuous monitoring and adjustments, which further refine the forecasts over time. By making complex predictions accessible and understandable, organizations can improve their strategic planning and resource allocation, ultimately driving better business outcomes.
12. What strategies can be implemented to ensure the sustainability and continuous improvement of domain-specific data collection and visualization initiatives?
Answer: To ensure the sustainability and continuous improvement of domain-specific data collection and visualization initiatives, organizations should adopt a strategic framework that emphasizes regular updates, continuous monitoring, and iterative refinement. This includes investing in scalable data architectures, cloud-based storage, and advanced visualization tools that can grow with the organization’s needs. Establishing clear data governance policies and performance metrics ensures that data quality and visualization effectiveness are maintained over time.
Moreover, fostering a culture of continuous learning and collaboration between data scientists, domain experts, and IT professionals is key to adapting to emerging trends and challenges. Regular feedback loops, training programs, and cross-departmental workshops can help refine processes and drive innovation. These strategies collectively ensure that data collection and visualization efforts remain relevant, effective, and aligned with evolving business objectives.
Domain-Specific Analytics: Numerical Problems and Solutions:
1. A dataset contains 10,000,000 records. If a sampling method selects 5% of these records for analysis, calculate the sample size, the total sample size for a 30-day period, and confirm the average daily sample size.
Solution:
• Step 1: Daily sample size = 10,000,000 × 0.05 = 500,000 records.
• Step 2: Total sample size for 30 days = 500,000 × 30 = 15,000,000 records.
• Step 3: Average daily sample = 15,000,000 ÷ 30 = 500,000 records.
2. A data cleaning algorithm reduces missing values by 80% in a dataset with 1,000,000 missing entries. Calculate the number of missing entries after cleaning, the number of entries fixed, and the percentage reduction.
Solution:
• Step 1: Entries fixed = 1,000,000 × 0.80 = 800,000 entries.
• Step 2: Missing entries after cleaning = 1,000,000 – 800,000 = 200,000 entries.
• Step 3: Percentage reduction = (800,000 ÷ 1,000,000) × 100 = 80%.
3. A normalization process scales data values from a range of 0–100 to 0–1. For a value of 75, calculate its normalized value, and then compute the inverse transformation for a normalized value of 0.6.
Solution:
• Step 1: Normalized value of 75 = 75 ÷ 100 = 0.75.
• Step 2: Inverse transformation for 0.6 = 0.6 × 100 = 60.
• Step 3: Therefore, 75 becomes 0.75 normalized, and 0.6 corresponds to 60.
4. A data cleaning process takes 0.003 seconds per record. For 2,000,000 records, calculate the total processing time in seconds, convert it to minutes, and then to hours.
Solution:
• Step 1: Total time = 2,000,000 × 0.003 = 6,000 seconds.
• Step 2: In minutes = 6,000 ÷ 60 = 100 minutes.
• Step 3: In hours = 100 ÷ 60 ≈ 1.67 hours.
5. A dataset has 500,000 duplicate records. After deduplication, duplicates are reduced by 90%. Calculate the number of duplicates removed, the number remaining, and the percentage reduction.
Solution:
• Step 1: Duplicates removed = 500,000 × 0.90 = 450,000.
• Step 2: Duplicates remaining = 500,000 – 450,000 = 50,000.
• Step 3: Percentage reduction = (450,000 ÷ 500,000) × 100 = 90%.
6. A feature scaling technique adjusts 1,200 values, originally ranging from 10 to 500, to a new range of 0 to 1. For a value of 255, calculate its normalized value using the formula (x – min) / (max – min).
Solution:
• Step 1: min = 10, max = 500, x = 255.
• Step 2: Normalized value = (255 – 10) ÷ (500 – 10) = 245 ÷ 490 = 0.5.
• Step 3: Therefore, the normalized value of 255 is 0.5.
7. A preprocessing pipeline reduces processing time per record from 0.005 seconds to 0.003 seconds. For 10,000,000 records, calculate the total time saved in seconds, then convert that to minutes, and finally to hours.
Solution:
• Step 1: Original total time = 10,000,000 × 0.005 = 50,000 seconds.
• Step 2: New total time = 10,000,000 × 0.003 = 30,000 seconds.
• Step 3: Time saved = 50,000 – 30,000 = 20,000 seconds; in minutes = 20,000 ÷ 60 ≈ 333.33 minutes; in hours = 333.33 ÷ 60 ≈ 5.56 hours.
8. A data preprocessing task involves standardizing 4,000,000 records. If each record takes 0.0025 seconds to standardize, calculate the total processing time in seconds, convert it to minutes, and then to hours.
Solution:
• Step 1: Total time = 4,000,000 × 0.0025 = 10,000 seconds.
• Step 2: In minutes = 10,000 ÷ 60 ≈ 166.67 minutes.
• Step 3: In hours = 166.67 ÷ 60 ≈ 2.78 hours.
9. A data transformation process applies logarithmic scaling to a dataset. If the original value is 1,000 and the transformation formula is log10(x), calculate the transformed value and then the inverse transformation to retrieve the original value.
Solution:
• Step 1: Transformed value = log10(1,000) = 3.
• Step 2: Inverse transformation = 10^3 = 1,000.
• Step 3: Thus, 1,000 is transformed to 3 and correctly reverted back to 1,000.
10. A cleaning process identifies 2% of 5,000,000 records as outliers. Calculate the number of outliers, then determine the number remaining if 75% are removed, and compute the percentage reduction.
Solution:
• Step 1: Outliers = 5,000,000 × 0.02 = 100,000 records.
• Step 2: Outliers removed = 100,000 × 0.75 = 75,000; remaining = 100,000 – 75,000 = 25,000.
• Step 3: Percentage reduction = (75,000 ÷ 100,000) × 100 = 75%.
11. A feature engineering task creates 3 new features from an original set of 20 features. Calculate the new total number of features, the percentage increase in features, and the final count if 25% of the new total features are deemed redundant.
Solution:
• Step 1: New total = 20 + 3 = 23 features.
• Step 2: Percentage increase = (3 ÷ 20) × 100 = 15%.
• Step 3: Redundant features = 23 × 0.25 ≈ 5.75, rounded to 6; final count = 23 – 6 = 17 features.
12. A data analytics project reduces processing time by 25% for a pipeline that originally takes 800 minutes per day. Calculate the new daily processing time, the daily time saved, and the annual time saved in hours (assume 365 days).
Solution:
• Step 1: New processing time = 800 × (1 – 0.25) = 800 × 0.75 = 600 minutes.
• Step 2: Daily time saved = 800 – 600 = 200 minutes.
• Step 3: Annual time saved = 200 × 365 = 73,000 minutes; in hours = 73,000 ÷ 60 ≈ 1,216.67 hours.