
Fluorescence imaging is one of the most powerful ways to see living systems with light. Instead of relying only on ordinary brightness, shadow, or colour, fluorescence imaging uses special molecules that absorb light of one wavelength and emit light of another. This allows scientists to make selected cells, tissues, proteins, organelles, microbes, or disease markers glow against a darker background.
This page introduces Fluorescence Imaging as part of the wider Bio-Optics cluster. It connects Light and Optics with cell biology, biomedical imaging, molecular diagnostics, microscopy, photonics, and medical research.
The main idea is simple but profound: if a biological structure can be labelled with a fluorescent marker, it can be made visible. A nucleus, a membrane, a protein, a bacterium, a cancer marker, or a signalling pathway can become a glowing signal. Fluorescence imaging therefore turns biology from something hidden into something traceable, measurable, and visually meaningful.
Learning Pathway Within the Bio-Optics Cluster
This page operations as an essential cellular and molecular visualization module within your Bio-Optics architecture. Use the non-duplicative pathway map below to navigate the cluster:
Fluorescence Imaging
Current page. Learn how fluorescent molecules, dyes, antibodies, and proteins make selected biological structures glow for imaging and analysis.Optical Coherence Tomography
Understand how reflected light and interference create cross-sectional images of biological tissues, especially in eye and medical imaging.Microscopy in Biology
Explore how optical microscopes, contrast methods, fluorescence, confocal systems, and digital imaging reveal cells, tissues, and microorganisms.Light-Based Medical Diagnostics
See how absorption, scattering, fluorescence, spectroscopy, OCT, endoscopy, and optical sensors support diagnostic measurement.What Fluorescence Imaging Really Means
Fluorescence imaging is an optical method that uses fluorescent substances to create contrast. A fluorescent molecule absorbs light at one wavelength, becomes excited, and then emits light at a longer wavelength. The emitted light is collected by lenses and detectors to form an image.
In ordinary brightfield microscopy, contrast often comes from absorption, staining, shadows, or differences in transparency. In fluorescence imaging, contrast comes from selective light emission. This means the structures of interest can appear bright while surrounding material remains relatively dark. This makes fluorescence imaging especially useful in biology because many important structures are transparent or difficult to distinguish under ordinary light. Fluorescence allows selected biological features to stand out clearly.
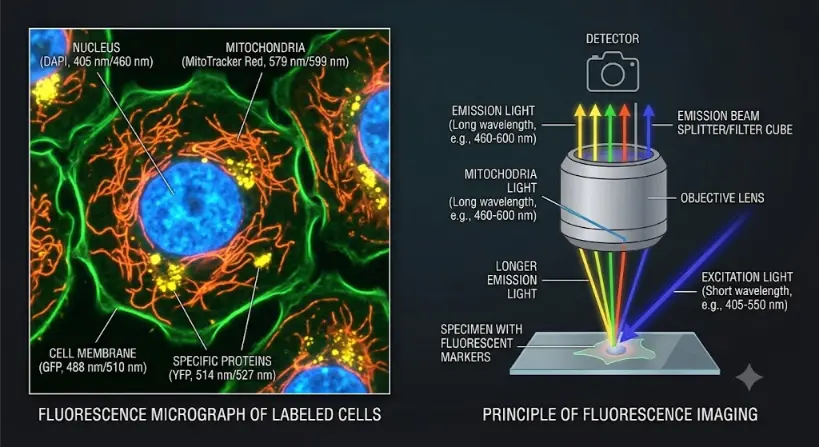
How Fluorescence Microscopy Illuminates the Microscopic World
Unlike traditional light microscopy which simply magnifies a specimen, fluorescence imaging relies on targeted light-emitting markers to contrast specific biological structures against a dark background. As demonstrated in the diagram above, the imaging process follows a precise optical cycle:
- Targeted Labeling: Specific cellular components are tagged with unique fluorescent dyes or proteins (fluorophores), such as the nucleus (blue), mitochondria (orange/red), cell membrane (green), and target proteins (yellow).
- Excitation: A high-energy, short-wavelength excitation light (typically blue or UV) is directed at the specimen.
- Emission: The fluorophores absorb this light and instantly transition to a lower energy state, releasing a longer, lower-energy wavelength of emission light.
- Detection: This shifted emission light passes through an objective lens and filter cube, isolating the glowing structures so they can be captured cleanly by a detector.
Theoretical Framework: Jablonski Diagrams, Quantum Yield Mechanics, and Franck-Condon Relaxation
To understand molecular luminescence with true undergraduate physical rigor, we must map out the electronic and vibrational energy states transitions that govern molecular glow.
The Jablonski Energy Diagram Pathway
The underlying electronic transitions of a fluorophore are classically visualized via a Jablonski diagram. In its ground state, the molecule sits at the lowest vibrational level of the lowest singlet electronic state, marked S0. When a photon matching the excitation energy criteria hits the molecule, it absorbs this energy within femtoseconds, causing an electronic transition up to an elevated vibrational level of a higher singlet state, such as S1 or S2:
S0 + hνex → S1
Following the Franck-Condon principle, nuclei do not change positions during the incredibly fast electronic transition. Once up in the S1 state, the molecule undergoes ultra-fast vibrational relaxation within picoseconds, dissipating excess kinetic heat energy into the surrounding environment until it drops to the absolute lowest vibrational sub-level of the S1 state. From this point, the molecule drops back down to a random vibrational level of the ground S0 state, releasing its remaining energy as an emitted photon:
S1 → S0 + hνem
Because energy is systematically lost during the vibrational relaxation phase, the emitted photon contains less energy than the initial excitation photon (hνem < hνex). This reduction in energy means the light is shifted to a longer wavelength, a phenomenon known as the Stokes shift.
The Mathematical Quantification of Quantum Yield
The diagnostic brightness of any fluorophore label depends directly on its Fluorescence Quantum Yield (Φ), which tracks the exact efficiency ratio of the emission process:
Φ = Emitted Photons Number / Absorbed Photons Number
We can express this quantum efficiency in terms of chemical rate constants:
Φ = kf / (ks + Σ knr)
Where kf represents the radiative rate constant for fluorescent emission, and Σ knr sums all competing non-radiative decay constants—including internal conversion, vibrational quenching, and intersystem crossing over to triplet phosphorescence states. Optimizing contrast in cell biology relies on selecting fluorophore labels that maximize kf while minimizing non-radiative losses, pushing Φ close to its upper limit of 1.0.
Excitation, Emission, and the Stokes Shift
The physical energy equations that define a single photon capture are written as:
$$E = hf = \frac{hc}{\lambda}$$Where E represents total photon energy, h tracks Planck’s constant, f marks wave frequency, and λ tracks absolute wavelength. This equation mathematically supports why the emission stream shifts to longer wavelengths; energy loss inside the molecular electronic shell forces a reduction in photon energy.
| Term | Meaning | Why It Matters |
|---|---|---|
| Excitation wavelength | The wavelength absorbed by the fluorophore | Chosen to stimulate fluorescence efficiently |
| Emission wavelength | The wavelength emitted by the fluorophore | Collected to form the image |
| Stokes shift | The difference between excitation and emission wavelengths | Allows filters to separate emitted fluorescence from excitation light |
| Fluorescence intensity | The brightness of emitted light | Relates to marker concentration, illumination, detector response, and imaging conditions |
Fluorophores and Fluorescent Labels
A fluorophore is a molecule that can fluoresce. Some fluorophores are synthetic dyes, while others are fluorescent proteins produced by living cells. Fluorophores are often attached to antibodies, nucleic acids, proteins, nanoparticles, or other biological markers.
| Fluorescent Label Type | Common Use | Example Purpose |
|---|---|---|
| Fluorescent dye | Staining cells, membranes, nuclei, or organelles | Highlighting cell structures |
| Fluorescent antibody | Binding to a specific protein or marker | Detecting disease markers or cell types |
| Fluorescent protein | Genetically tagging proteins in living cells | Tracking protein location and movement |
| Fluorescent probe | Responding to pH, calcium, oxygen, or other conditions | Measuring biological activity |
| Quantum dot | Bright nanoscale fluorescent label | Long-term or multiplexed imaging in selected research settings |
Main Parts of a Fluorescence Microscope
A fluorescence microscope must excite the specimen and collect the emitted light while separating the two signals. The key components work together as an optical pathway.
| Component | Main Role | Student-Friendly Meaning |
|---|---|---|
| Light source or laser | Provides excitation light | Makes fluorophores glow |
| Excitation filter | Selects the excitation wavelength | Chooses the colour used to excite the label |
| Dichroic mirror | Reflects excitation light but transmits emission light | Separates incoming and outgoing light paths |
| Objective lens | Focuses excitation light and collects emission light | The main optical lens near the specimen |
| Emission filter | Blocks unwanted light and passes fluorescence emission | Lets the useful glow reach the detector |
| Camera or detector | Records the fluorescence image | Turns weak light into data |
| Computer and software | Processes, displays, and analyses images | Converts images into measurements |
Advanced Imaging Methodologies
To bypass the out-of-focus blur common in broad widefield illumination systems, biomedical setups apply specialized optical configurations:
Confocal Fluorescence Microscopy
Optical Mechanism: Places a pinhole aperture directly in the conjugate focal plane of the detector path to block out-of-focus light.Biological Application: Captures sharp optical sections through thick cells and tissue matrices, allowing high-contrast three-dimensional digital volume reconstructions.Multiphoton Fluorescence Imaging
Optical Mechanism: Drives high-density, near-infrared laser tracks where excitation requires the near-simultaneous absorption of two or more low-energy photons.Biological Application: Restricts excitation strictly to the focal point, reducing background photobleaching while using longer wavelengths to penetrate deep into scattering live tissue.Super-Resolution Systems
Optical Mechanism: Uses targeted laser patterns (like STED depletion donuts) or single-molecule switching to bypass classical diffraction limits.Biological Application: Allows researchers to resolve macromolecular interactions, protein matrices, and virus structures below the traditional 200 nm optical limit.Fluorescence Imaging Workflow
A fluorescence imaging experiment is not only about capturing a colourful picture. It requires planning, labelling, imaging, controls, analysis, and interpretation.
| Step | What Happens | Why It Matters |
|---|---|---|
| Define the biological question | Decide what structure, molecule, or process is being studied | Prevents unfocused imaging |
| Choose fluorophore or label | Select dye, antibody, fluorescent protein, or probe | Determines specificity and signal quality |
| Prepare specimen | Fix, stain, culture, section, or keep cells alive as needed | Affects biological meaning and image quality |
| Select microscope settings | Choose excitation, filters, exposure, gain, objective, and channels | Controls brightness, noise, resolution, and damage risk |
| Acquire controls | Use negative controls, single-colour controls, or unstained samples | Helps identify background, bleed-through, and false signal |
| Analyse images | Measure intensity, location, shape, count, overlap, or time changes | Turns images into evidence |
| Interpret carefully | Connect image data with biology and experimental limits | Avoids overclaiming from visual appearance alone |
Operational Constraints and Realities
Researchers must carefully manage several competing optical and environmental factors during live-cell imaging:
| Limitation Class | Physical Meaning | Practical Impact on Experiments |
|---|---|---|
| Photobleaching | Permanent structural destruction of a fluorophore’s ring due to high light exposure. | The fluorescence signal fades over time during time-lapse tracking. |
| Phototoxicity | Excited fluorophores generate reactive oxygen species that damage cells. | Alters cell behavior or causes cell death during live-cell imaging. |
| Autofluorescence | Natural background emission from cellular components like NADH, flavins, or structural collagen. | Creates background noise that can obscure weak target signals. |
| Bleed-Through | Spectral overlap where a fluorophore’s emission tail spills into an adjacent detector channel. | Can lead to false positives when evaluating the colocalisation of two targets. |
Case Studies: Fluorescence Imaging in Action
Case Study 1: Labelling the Cell Nucleus
A simple fluorescence experiment may use a nuclear stain to label DNA. Under the microscope, each nucleus appears as a bright region. This allows researchers to count cells, observe cell division, identify tissue organisation, or detect abnormal nuclear shapes. This case study shows how fluorescence can turn a nearly transparent structure into a measurable feature.
Case Study 2: Tracking a Protein in a Living Cell
A protein can be linked to a fluorescent protein so that its location can be followed in a living cell. Researchers may observe whether the protein stays in the cytoplasm, moves into the nucleus, gathers at the membrane, or changes location after a signal. This case study shows how fluorescence imaging can study biological processes over time, not only fixed structures.
Case Study 3: Identifying Bacteria with Fluorescent Probes
Fluorescent probes can bind to selected microbial targets. Under suitable imaging conditions, labelled microbes appear as bright signals against a darker background. This can help researchers identify microbial populations or study microbial communities. This case study connects fluorescence imaging with microbiology, infection research, and environmental biology.
Case Study 4: Measuring Calcium Signals
Some fluorescent indicators change brightness when calcium concentration changes. Because calcium is an important signalling ion in many cells, fluorescence imaging can reveal waves, pulses, or local changes in cellular activity. This case study shows how fluorescence can measure function, not only structure.
Case Study 5: Detecting Tissue Markers
In biomedical research and pathology, fluorescent antibodies can label selected proteins in tissue sections. Comparing the pattern of markers can help reveal cell types, disease-related changes, or the organisation of tissue microenvironments. This case study shows why fluorescence imaging is important in medical research and diagnostic development.
Applications of Fluorescence Imaging
Fluorescence imaging is widely used because it can combine spatial detail with molecular specificity. It does not simply show that a cell exists; it can show where a particular molecule, structure, or process is located.
Cell Biology Diagnostics
Fluorescence imaging reveals the organization of cell nuclei, membrane dynamics, mitochondria networks, and cytoskeletal structures during division.Microbiology and Pathogens
Fluorescent stains help identify bacterial strains, evaluate membrane integrity to separate alive from dead cells, and map out biofilm structures.Neuroscience Circuit Tracking
Calcium imaging indicator dyes allow researchers to monitor real-time synaptic signals, track calcium waves, and observe network firing patterns.Oncology Research
Fluorescently tagged antibodies spotlight active tumor surface receptors, helping track tumor margins and monitor cell responses to targeted therapies.Connections with Wider Physics and Technology
Fluorescence imaging is a bridge between biology and optical physics. It depends on light-matter interaction, wavelength selection, lenses, filters, detectors, image processing, and careful experimental design within the broader framework of Light and Optics.
Wave Optics
Diffraction limits, phase parameters, and spatial frequencies govern the absolute boundaries of microscope resolution and collection efficiency.Quantum Optics
Fluorescence relies on discrete single-photon absorption and radiative decay pathways, providing a practical biological demonstration of quantum light-matter transitions.Laser Optics
Highly focused, coherent laser sources provide the stable illumination needed for advanced confocal, multiphoton, and super-resolution scanning microscope systems.Photonics
Photonics systems supply the high-rejection dichroic bandpass filters, optical wave guides, and single-photon counting arrays that isolate fluorescent signals.Medical Imaging
Molecular fluorescence assays support tumor margin identification, guided surgical pathology, and real-time internal endoscopy tracks.Data Science and Analytics
Digital images require computational segmentation, pixel intensity calculations, background deconvolution, and statistical colocalisation processing.Common Conceptual Misunderstandings
The Raw Snapshot Illusion
Misconception: Fluorescence images are simple, true-to-life color photographs. Reality: Most images are false-color data visualisations. Detectors record individual channel gray-scale intensities, and software assigns distinct display colors to make overlapping structures scannable.The Power Intensity Fallacy
Misconception: Cranking up the excitation laser power to maximum always yields a higher quality image. Reality: Excess light acceleration drives severe photobleaching and produces high cellular phototoxicity, destroying both the fluorophore labels and the living biology being tracked.Quick Check: Fluorescence Imaging
Quick Check: Fluorescent Light
Q1. Why does fluorescence imaging often show bright structures on a dark background?
Only labelled structural elements contain fluorophore molecules that actively emit light, whereas background fields remain dark if optical bandpass filters are aligned correctly.
Q2. What is the difference between excitation light and emission light?
Excitation light is short-wavelength, high-energy light absorbed by the fluorophore. Emission light is long-wavelength, lower-energy light released by the molecule as it returns to its ground state.
Q3. Why is the Stokes shift useful?
The Stokes shift separates absorption and emission wavelengths, allowing optical filters to block intense excitation light while passing weak fluorescence to the detector.
Q4. Why must live-cell fluorescence imaging use light carefully?
High illumination intensities accelerate photobleaching and generate free radicals, causing phototoxicity that can stress or kill living cell specimens.
Numerical Practice: Luminescence Problems
Numerical Problems and Solutions
1. A fluorophore is excited by light of wavelength 480 nm. Calculate the energy of one excitation photon.
Apply Planck’s equation:
$$E = \frac{hc}{\lambda}$$Convert wavelength metrics to base meters ($480\text{ nm} = 480 \times 10^{-9}\text{ m}$):
$$E = \frac{(6.626 \times 10^{-34}\text{ J}\cdot\text{s}) \times (3.00 \times 10^8\text{ m/s})}{480 \times 10^{-9}\text{ m}}$$
$$E = \frac{1.9878 \times 10^{-25}}{480 \times 10^{-9}} \approx 4.14 \times 10^{-19}\text{ J}$$Answer: The single photon energy is approximately 4.14 × 10⁻¹⁹ Joules.
2. A fluorophore emits light at 530 nm after absorbing an excitation wavelength of 480 nm. Compute the absolute Stokes shift in nanometres.
Subtract the absorbed entry wavelength from the primary emission wavelength path:
$$\text{Stokes Shift} = \lambda_{\text{emission}} – \lambda_{\text{excitation}}$$
$$\text{Stokes Shift} = 530\text{ nm} – 480\text{ nm} = 50\text{ nm}$$Answer: The calculated Stokes shift measures exactly 50 nm.
3. A fluorescence image registers a target cellular intensity count of 1200 units and an ambient background background profile of 300 units. Determine the background-corrected signal.
Apply basic background signal cleaning subtraction:
$$\text{Corrected Signal} = 1200\text{ units} – 300\text{ units} = 900\text{ units}$$Answer: The background-corrected signal evaluates to 900 units.
4. A cell sample loses exactly 25% of its brightness during an extended exposure run due to photobleaching. If the initial tracking reading measured 800 intensity units, calculate the final remaining brightness.
Determine the remaining transmission fraction index ($1.00 – 0.25 = 0.75$):
$$\text{Remaining Brightness} = 800\text{ units} \times 0.75 = 600\text{ units}$$Answer: The final remaining emission brightness tracks at 600 units.
5. A digital camera array records an effective pixel size configuration representing 0.20 μm on the specimen plane. An imaged live cell body spans 75 pixels across the sensor tracker. Estimate the diameter of the cell.
Multiply the linear pixel count footprint by the verified spatial dimension factor:
$$\text{Cell Diameter} = 75\text{ pixels} \times 0.20\text{ μm/pixel} = 15.0\text{ μm}$$Answer: The cell measures approximately 15 μm in diameter.
6. A photon counter counts 5000 individual fluorescence events over a continuous recording interval of 2.0 s. Determine the mean count rate.
Divide the total recorded count value by the sampling duration:
$$\text{Count Rate} = \frac{5000\text{ counts}}{2.0\text{ s}} = 2500\text{ counts/s}$$Answer: The operational capture speed tracks at 2500 counts per second.
Key Terms
- Fluorescence
- The emission of light by a molecule after it absorbs light of suitable energy.
- Fluorophore
- A molecule or functional chemical group that can absorb excitation light and emit fluorescence.
- Excitation
- The structural process in which a fluorophore absorbs a photon and enters a higher-energy electronic state.
- Emission
- The release of light from an excited fluorophore as it returns toward a lower-energy state.
- Stokes shift
- The physical difference between the peak excitation wavelength and the longer peak emission wavelength.
- Dichroic mirror
- An optical component that reflects some wavelengths and transmits others, helping separate excitation and emission light fields.
- Photobleaching
- The permanent chemical destruction of a fluorophore’s ability to fluoresce after exposure to light.
- Phototoxicity
- Light-induced damage or structural stress triggered inside living cell specimens during optical illumination tracking.
External References for Further Reading
MicroscopyU: Introduction to Fluorescence Microscopy — Technical overviews detailing excitation illumination paths, filter selection cubes, and baseline system alignment.
OpenStax Microbiology: Instruments of Microscopy — Open educational resources analyzing specialized contrast systems and diagnostics platforms.
Fluorescence Microscopy Methods in Biological Research — Scientific summaries outlining advanced widefield, confocal, and multi-photon scanning protocols.
Nobel Prize in Chemistry 2008: Green Fluorescent Protein — Historical files tracking the tracking, genomic sequencing, and industrial implementation of GFP vectors.
Summary
Fluorescence imaging stands as a cornerstone method within modern bio-optics, demonstrating how targeted molecular contrast can make hidden structures traceable. By exploiting the Stokes shift using specialized filters and dichroic mirrors, microscopes can capture clear, bright target signatures against a clean, dark background. While practical challenges like photobleaching, phototoxicity, and ambient autofluorescence require close management, the high molecular specificity of fluorescence imaging makes it an indispensable tool for tracking living systems across medical diagnostics, neuroscience, and cellular discovery.
Reflection Question
If fluorescence imaging lets us choose exactly which molecules and signaling pathways become visible inside a cell, how might future refinements in sub-diffraction super-resolution systems change our understanding of basic cellular life and complex disease origins?