
Atomic Spectra and Energy Transitions explain how atoms produce, absorb, and reveal light through discrete changes in electron energy. Unlike everyday classical systems, where energy often appears to vary smoothly, atoms operate in quantised steps. Electrons can occupy only certain allowed energy levels. When they move from one level to another, they emit or absorb photons with precise energies, producing the sharp spectral lines seen in atomic spectra.
This image illustrates how atomic spectra arise from electron transitions between quantised energy levels.
    When electrons move from one allowed level to another, photons with specific energies are emitted or absorbed.
    These fixed photon energies produce sharp spectral lines, giving scientists indirect evidence of atomic structure.
These spectral lines act like fingerprints of elements. Hydrogen, sodium, nitrogen, and other elements each produce distinctive patterns because their internal energy levels are different. By studying these patterns, scientists can identify substances in laboratories, analyse the composition of stars, and study distant galaxies. Atomic spectra therefore provide a powerful bridge between visible evidence and invisible quantum structure, helping students see how microscopic electron behaviour becomes observable through light.
1. Learning Pathway within Atomic Physics
Atomic Spectra and Energy Transitions belongs to the Atomic Physics cluster. It focuses on how electrons move between quantised energy levels and how these movements produce the emission and absorption lines seen in atomic spectra. This topic connects atomic structure, quantum numbers, electron configuration, radiation, and spectroscopy, helping students understand how light can reveal the hidden structure of atoms.
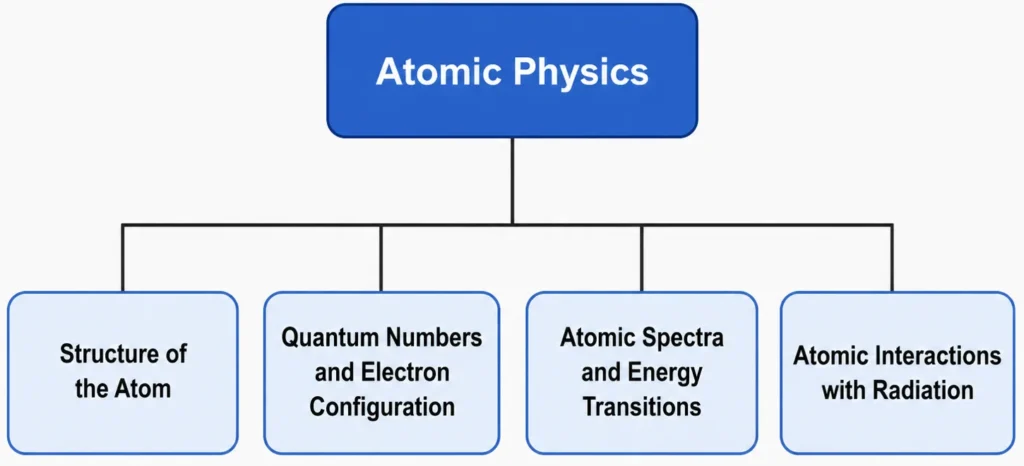
This structure chart shows how Atomic Spectra and Energy Transitions fits within the wider Atomic Physics cluster.
    It sits alongside Structure of the Atom, Quantum Numbers and Electron Configuration, and Atomic Interactions with Radiation.
    The chart helps students see that atomic spectra are not an isolated topic, but part of a wider study of atomic structure, allowed electron states, energy transitions, and interactions between atoms and light.
Atomic Physics
Provides the wider framework for understanding atomic structure, electron behaviour, quantised energy levels, spectra, and interactions between atoms and radiation.Structure of the Atom
Explains how atoms are organised, including the nucleus, electrons, orbitals, and the shift from classical atomic models to quantum descriptions.Quantum Numbers and Electron Configuration
Describes how quantum numbers, shells, subshells, orbitals, and spin states determine the allowed electron arrangements within atoms.Atomic Spectra and Energy Transitions
Explores how electron transitions between quantised energy levels produce emission and absorption spectra that reveal atomic structure.Atomic Interactions with Radiation
Examines how atoms absorb, emit, scatter, and respond to photons through processes such as excitation, ionisation, fluorescence, and stimulated emission.2. What Atomic Spectra REALLY Represent
Atomic spectra are not just patterns of light. They are direct evidence that energy inside atoms is quantised. Each spectral line corresponds to a specific transition between allowed energy levels, showing that electrons cannot occupy just any continuous range of energies. Instead, they exist only in certain permitted states.
When an electron moves from a higher energy level to a lower one, it releases energy in the form of a photon. When an electron moves from a lower energy level to a higher one, it absorbs a photon with just the right energy. In both cases, the photon energy matches the difference between the two levels. This is why atomic spectra contain sharp lines rather than a smooth, continuous spread of colours.
In this way, atomic spectra act as a window into the hidden structure of atoms. We cannot see electron energy levels directly, but we can infer their existence from the wavelengths of light that atoms emit or absorb. Spectral lines therefore connect abstract quantum ideas with observable physical evidence.
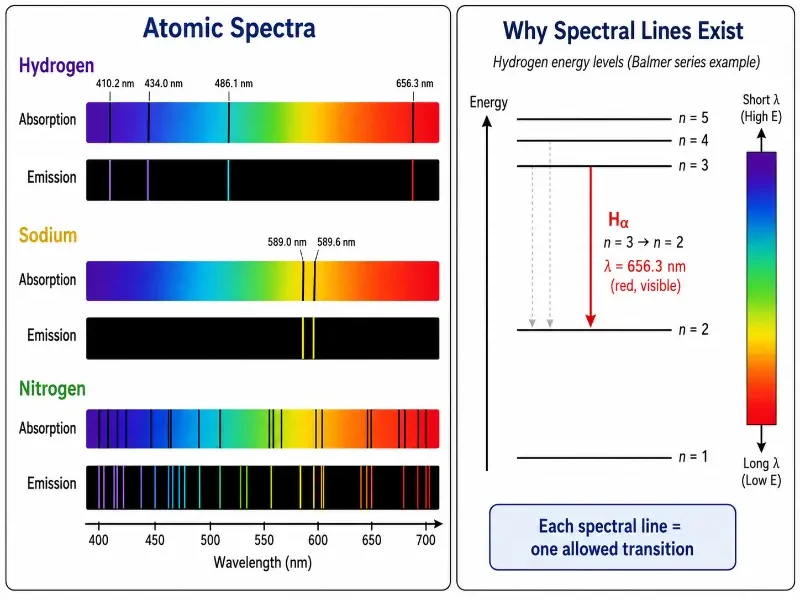
This illustration shows how atomic spectra provide evidence for quantised energy levels in atoms.
    The left panel compares absorption and emission spectra for hydrogen, sodium, and nitrogen.
    Absorption spectra appear as dark lines within a continuous visible spectrum, while emission spectra appear as bright coloured lines on a dark background.
    The hydrogen spectrum highlights the main visible Balmer lines, including the red H-alpha line at 656.3 nm, while sodium shows its characteristic yellow doublet and nitrogen shows a richer line pattern.
    The right panel explains why these lines exist by showing a hydrogen energy-level diagram. A downward transition from n = 3 to n = 2 emits a photon with a specific wavelength, producing the H-alpha spectral line. The diagram helps students connect observed spectral lines with discrete electron energy transitions.
Pause and Think: What Is a Spectral Line Really Telling Us?
A spectral line is not just a coloured mark on a screen. It is evidence that an electron has moved between two allowed energy levels inside an atom.
If each line corresponds to a specific energy change, what does this suggest about the hidden structure of the atom?
A useful way to think about it is this: the spectrum is like a message from the atom. We cannot see the energy levels directly, but we can read their presence through the light the atom emits or absorbs.
3. Understanding Atomic Spectra and Energy Level Principles
Atomic spectra arise when atoms absorb or emit light as electrons move between quantised energy levels. These spectra may appear as bright emission lines or dark absorption lines, depending on whether photons are released by atoms or removed from a passing beam of light. Together, emission and absorption spectra reveal how atoms interact with energy, radiation, and their surrounding environment.
The important idea is that atoms do not emit or absorb every possible colour of light. Instead, each atom responds only to photons whose energies match the gaps between its allowed electron energy levels. This is why spectra appear as sharp lines rather than as random or continuous patterns.
Energy Levels in Atoms
Electrons occupy discrete energy levels rather than a continuous range of energies. These allowed levels determine which photon energies an atom can emit or absorb, forming the foundation for all atomic spectral behaviour.Emission Spectra
Emission spectra are produced when excited electrons drop from higher energy levels to lower ones. The lost energy is released as photons of specific wavelengths, producing bright coloured lines on a dark background.Absorption Spectra
Absorption spectra form when atoms absorb photons from a continuous light source. Electrons move to higher energy levels, and the absorbed wavelengths appear as dark lines within the continuous spectrum.Hydrogen Spectrum
The hydrogen spectrum is the simplest and most historically important atomic spectrum. Its Lyman, Balmer, and Paschen series helped reveal that electron energies in atoms are quantised and mathematically predictable.4. Energy Levels and Electron Transitions
- Quantised Energy Levels: Electrons in atoms can occupy only specific, discrete energy levels. These levels arise from the quantum mechanical nature of electrons, where only certain standing-wave states are allowed. As a result, electrons cannot simply exist at any intermediate energy between two allowed levels.
- Energy Differences Between Levels: Each energy level has a well-defined energy value. When an electron moves between two levels, the energy exchanged is equal to the difference between those levels. Larger energy gaps correspond to higher-energy photons with shorter wavelengths, while smaller gaps correspond to lower-energy photons with longer wavelengths.
- Photon–Energy Relationship: The energy of a photon emitted or absorbed during a transition is related to its frequency by E = hν, where E is energy, h is Planck’s constant, and ν is frequency. The same relationship may also be written as E = hc / λ, linking electron transitions directly to observable spectral wavelengths.
When an electron absorbs energy, either through thermal collisions or incoming radiation, it can move to a higher energy level. This process is called excitation. However, excited states are usually unstable. After a short time, the electron returns to a lower energy level and releases the excess energy as a photon. This process is called emission.
Each transition between two allowed energy levels produces or absorbs a photon with a precise energy and wavelength. Because only specific transitions are allowed, atomic spectra consist of sharp, discrete lines rather than a continuous distribution. These lines form the characteristic emission and absorption spectra of each element.
In multi-electron atoms, interactions between electrons modify the energy levels and produce more complex spectra. However, the underlying principle remains the same: atomic structure determines the allowed energy states, and transitions between those states produce observable radiation.
This quantised behaviour marks a fundamental departure from classical physics. Instead of energy changing smoothly, atomic systems exchange energy in discrete packets, or quanta. The study of these transitions provides direct experimental evidence for quantum theory and forms the basis for technologies such as spectroscopy, lasers, and atomic clocks.
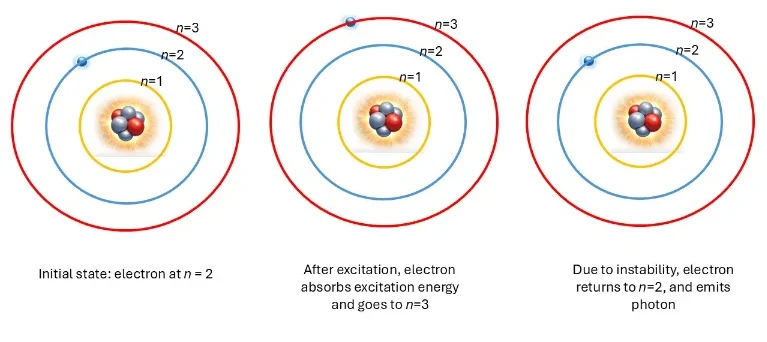
This diagram illustrates electron transitions between quantised energy levels in an atom.
    Starting at n = 2, the electron absorbs energy and moves to n = 3.
    The excited state is unstable, so the electron returns to n = 2, releasing the excess energy as a photon. This process demonstrates how discrete energy levels produce emission spectra.
Key Idea: Spectral Lines Come from Energy Gaps
Every spectral line is connected to an energy difference between two allowed electron levels. When an electron moves from a higher level to a lower level, the atom emits a photon. The energy of that photon is equal to the gap between the two levels.
$$ E_{\text{photon}} = \Delta E = E_{\text{high}} – E_{\text{low}} $$
This is why atoms produce sharp spectral lines rather than a continuous spread of colours. The atom is not free to emit just any photon energy; it emits only the energies allowed by its internal structure.
Concept Check: What Happens During Emission?
An electron in an atom is excited from n = 2 to n = 3. Later, it returns from n = 3 to n = 2. What happens during the return transition?
A. The electron absorbs a photon.
B. The electron emits a photon.
C. The electron disappears from the atom.
D. The atom becomes a different element.
The correct answer is B. When an electron falls from a higher energy level to a lower energy level, the atom emits a photon.
The photon energy is determined by the energy difference between the two levels:
$$ E_{\text{photon}} = h\nu = \frac{hc}{\lambda} $$
A larger energy gap produces a higher-frequency photon with a shorter wavelength. A smaller energy gap produces a lower-frequency photon with a longer wavelength.
Think Deeper: Why Is a Spectrum Like an Atomic Fingerprint?
Each element has its own arrangement of allowed energy levels. Because of this, each element emits and absorbs its own unique set of photon energies.
This means that a spectrum can identify an element, much like a fingerprint identifies a person. Hydrogen, helium, sodium, mercury, and other elements all produce different spectral patterns because their internal energy structures are different.
This is why scientists can identify elements in laboratory samples, gas discharge tubes, stars, and galaxies simply by analysing the light they emit or absorb.
5. Hydrogen Spectrum and Spectral Series
Hydrogen, the simplest atom, gives one of the clearest demonstrations of how quantised energy levels produce spectral lines. Its single electron can occupy only specific energy levels, labelled by the principal quantum number n = 1, 2, 3, and so on. Each level has a definite energy, so any transition between two levels involves a precise amount of energy.
When an electron moves from a higher energy level to a lower one, the atom releases the energy difference as a photon. This relationship can be written as:
ΔE = Ehigh − Elow = hν
Here, h is Planck’s constant and ν is the frequency of the emitted light. Because the energy difference between the two levels is fixed, the photon frequency is also fixed. This is why hydrogen does not emit every possible colour of light, but only specific wavelengths corresponding to allowed electron transitions.
For hydrogen, the allowed energy levels follow a simple pattern:
En = −13.6 / n2 eV
This formula shows that the energy levels are negative because the electron is bound to the atom. The level n = 1 is the ground state, while higher values of n represent excited states. As n increases, the levels become closer together and approach zero energy, which corresponds to ionisation.
For example:
- E1 = −13.6 eV
- E2 = −3.4 eV
- E3 = −1.51 eV
Now consider a transition from n = 3 to n = 2. The photon energy is:
ΔE = E3 − E2 = (−1.51) − (−3.4) = 1.89 eV
This energy corresponds to a particular frequency and wavelength in the visible region. In fact, the transition from n = 3 to n = 2 produces the red H-alpha line of the Balmer series, with a wavelength of about 656.3 nm. This is one reason hydrogen produces distinct coloured lines rather than a continuous spectrum.
Hydrogen transitions form groups known as spectral series. Each series is defined by the final energy level reached by the electron:
- Lyman Series: Transitions ending at n = 1 produce high-energy photons in the ultraviolet region.
- Balmer Series: Transitions ending at n = 2 produce visible and near-visible lines, including the red H-alpha line at about 656.3 nm.
- Paschen Series: Transitions ending at n = 3 produce lower-energy photons in the infrared region.
- Brackett Series: Transitions ending at n = 4 produce photons in the far infrared region.
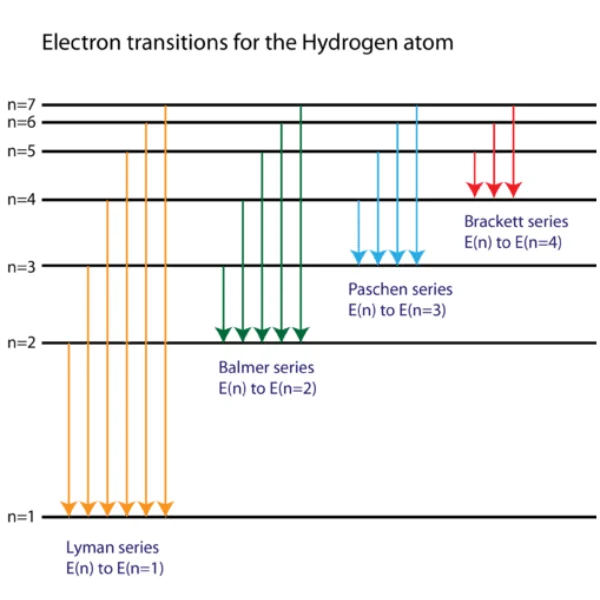
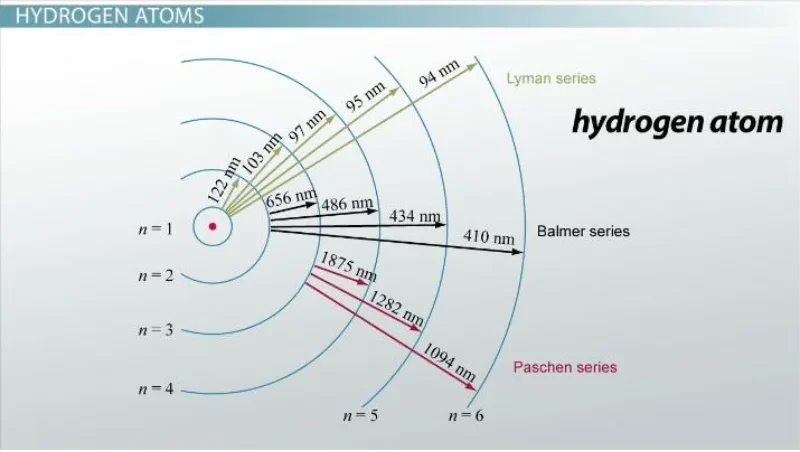
This diagram presents the quantised energy levels of the hydrogen atom and the electron transitions that produce different spectral series.
    Transitions ending at n = 1 form the Lyman series in the ultraviolet region, transitions ending at n = 2 form the Balmer series in the visible and near-visible region, transitions ending at n = 3 form the Paschen series in the infrared region, and transitions ending at n = 4 form the Brackett series in the far infrared.
    Each downward arrow represents photon emission from a higher level to a lower level. The diagram helps students see how discrete energy differences lead to distinct spectral lines and why each series appears in a particular region of the electromagnetic spectrum.
The key insight is that different transitions have different energy gaps. Different energy gaps produce different photon frequencies and wavelengths. These wavelengths may fall in the ultraviolet, visible, infrared, or far-infrared regions of the electromagnetic spectrum.
Hydrogen is especially important because its simple structure made it a testing ground for early quantum theory. The regularity of its spectral lines helped physicists recognise that electron energies in atoms are not continuous but quantised.
The same principle applies to other elements, although their spectra are more complex because they contain many electrons. Each element has its own pattern of allowed energy levels, so each produces a unique set of spectral lines. This is why spectra can act as atomic fingerprints, allowing scientists to identify substances in laboratory samples, stars, nebulae, and distant galaxies.
6. History, Challenges, and Future Prospects: From Experiment to Theory
The hydrogen energy-level formula
$$ E_n = -\frac{13.6}{n^2} \text{ eV} $$
did not appear suddenly as a finished theoretical result. It grew out of careful observation of light emitted by hydrogen atoms. Its history shows one of the most important patterns in physics: experiment first reveals a regularity, mathematics captures the pattern, and theory later explains why the pattern exists.
The story of atomic spectra is therefore not only a story about atoms. It is also a story about how science moves from visible evidence to invisible structure, and from measured spectral lines to a deeper understanding of quantised energy levels.
Step 1: Patterns in Light — Balmer’s Discovery
In 1885, Johann Balmer studied the visible spectral lines of hydrogen. By analysing experimental data, he found a simple mathematical relationship that accurately predicted the wavelengths of these lines. At that time, Balmer did not have a physical explanation for the pattern. His formula was empirical: it described a regularity found in the data.
This discovery was important because it showed that atomic spectra were not random collections of colours. The lines followed precise numerical rules, suggesting that some hidden order existed within the atom.
Step 2: Generalisation — The Rydberg Formula
Johannes Rydberg extended Balmer’s work by proposing a more general formula for hydrogen spectral lines:
$$ \frac{1}{\lambda} = R_H \left( \frac{1}{n_f^2} – \frac{1}{n_i^2} \right) $$
Here, λ is the wavelength of the spectral line, RH is the Rydberg constant for hydrogen, ni is the initial energy level, and nf is the final energy level, with ni > nf for emission.
This equation successfully described hydrogen spectral lines in the ultraviolet, visible, and infrared regions. It was remarkably accurate, but it still lacked a deeper physical explanation. It described what happened, but not why hydrogen atoms produced those particular wavelengths.
Step 3: Theoretical Breakthrough — The Bohr Model
In 1913, Niels Bohr introduced a new model of the hydrogen atom. He proposed that electrons could occupy only certain allowed energy levels, and that light was emitted or absorbed when electrons moved between these levels.
Using classical ideas together with a new quantum condition, Bohr derived the hydrogen energy levels:
$$ E_n = -\frac{13.6}{n^2} \text{ eV} $$
For the first time, the empirical spectral formulas were connected to a physical model of atomic structure. The spectral lines were no longer just mathematical patterns. They became evidence for quantised electron energy levels inside the atom.
Step 4: Quantum Mechanics — The Modern Understanding
Later developments in quantum mechanics provided a deeper and more accurate explanation. In modern quantum theory, electrons are not treated as tiny planets moving in fixed circular orbits. Instead, they are described by wavefunctions that give probability distributions for where electrons may be found.
Despite this conceptual shift, the hydrogen energy-level formula still emerges naturally from the quantum-mechanical treatment of the hydrogen atom. This confirmed that Balmer’s pattern, Rydberg’s formula, and Bohr’s model were all pointing toward a deeper quantum structure.
Modern Challenges and Frontiers
Today, experimental atomic physics faces challenges in measuring energy levels of multi-electron systems due to complex electron correlation and relativistic effects. Modern optical atomic clocks utilize ultra-narrow atomic transitions to measure time with uncertainties under 1 part in 1018, opening future frontiers in testing fundamental physical constants and exploring quantum gravity.
Key Insight: Physics Often Begins with Patterns
The story of hydrogen spectra shows that physics does not always begin with a complete theory. Sometimes it begins with careful measurement and pattern recognition. Balmer first found a mathematical pattern in visible hydrogen lines before anyone fully understood why the pattern existed.
Rydberg then generalised the pattern, Bohr connected it to quantised electron levels, and quantum mechanics later gave a deeper explanation. This reminds students that scientific knowledge often develops in stages: observation first, formula next, model later, and deeper theory after that.
Concept Check: What Did Bohr Explain?
Balmer and Rydberg discovered formulas that described hydrogen spectral lines. Bohr’s major contribution was to connect those spectral patterns to quantised electron energy levels. Which statement best describes Bohr’s contribution?
A. He discovered that hydrogen has no spectral lines.
B. He showed that electron transitions between quantised energy levels could explain hydrogen spectra.
C. He proved that electrons move with any possible energy.
D. He showed that spectra are random and cannot be predicted.
The correct answer is B. Bohr explained hydrogen spectra by proposing that electrons could occupy only specific energy levels. When an electron moved between these levels, the atom absorbed or emitted a photon with a precise energy.
This helped explain why hydrogen produces discrete spectral lines instead of a continuous spectrum.
7. Modern Relevance and Applications of Atomic Spectra
Atomic spectra remain one of the most powerful tools for identifying substances and understanding physical systems. Because each element has its own arrangement of quantised energy levels, it emits and absorbs light in a distinctive pattern of spectral lines. These patterns are often described as atomic fingerprints because they allow scientists to recognise elements even when the material being studied is extremely hot, very dilute, very distant, or impossible to touch directly.
The value of atomic spectra goes far beyond recognising colours in a laboratory flame test. Spectral lines can reveal composition, temperature, density, motion, pressure, ionisation state, and environmental conditions. This makes spectroscopy important in astronomy, chemistry, engineering, environmental science, plasma physics, forensic science, and many modern technologies.
Astrophysics and Cosmology
Spectral lines allow scientists to identify elements in stars, nebulae, galaxies, and interstellar gas by comparing observed spectra with known laboratory spectra. Hydrogen Balmer lines, for example, are widely used in stellar studies. Shifts in spectral lines also reveal motion through the Doppler effect, helping scientists measure stellar velocities, galactic rotation, and the expansion of the universe.Chemical Analysis and Laboratory Spectroscopy
In laboratories, emission and absorption spectra are used to identify unknown substances. Each element produces a unique line pattern because its electron energy levels are distinct. Sodium shows a strong yellow doublet, mercury produces several coloured lines, and hydrogen produces simple but important spectral series. By matching observed lines with reference spectra, chemists can determine the composition of a sample.Environmental Monitoring
Atomic spectroscopy helps detect trace elements in air, water, soil, food, and industrial waste. Techniques such as atomic absorption spectroscopy and emission spectroscopy can identify pollutants such as lead, mercury, cadmium, and arsenic at very low concentrations. Because each element absorbs or emits specific wavelengths, even small amounts of contamination can be measured accurately.Materials Science and Engineering
Spectroscopic methods are used to analyse the composition, purity, and electronic behaviour of materials. Emission spectra can reveal impurities in metals, while optical and atomic spectroscopy can help study semiconductors, coatings, ceramics, alloys, and nanomaterials. This is important in electronics, energy systems, aerospace engineering, quality control, and advanced manufacturing.Plasma Physics and Industrial Processes
High-temperature plasmas contain atoms and ions that emit characteristic spectral lines. By analysing these lines, scientists and engineers can estimate plasma temperature, density, composition, and ionisation state. This is useful in fusion research, semiconductor fabrication, plasma cutting, welding, lighting technologies, and the study of auroras and space plasmas.Forensic Science and Security
Spectroscopy can help identify unknown powders, residues, metals, pigments, explosives, drugs, and trace materials. In forensic investigations, spectral signatures may help link a sample to a source or reveal the presence of substances that are difficult to identify by appearance alone. In security settings, spectroscopic techniques can support non-destructive testing and rapid material identification.Common Misconceptions in Atomic Spectra
Many difficulties in atomic physics arise not from difficult mathematics, but from subtle misunderstandings of core ideas. Atomic spectra require students to think carefully about quantised energy levels, electron transitions, photon emission, photon absorption, and the meaning of spectral lines.
“Electrons Can Have Any Energy”
A common misunderstanding is that electrons can possess any energy within a range. In atoms, electron energies are quantised. Electrons can occupy only specific allowed energy levels, not arbitrary values between them. This is why atomic spectra show distinct lines rather than a continuous spread of colours.“Spectral Lines Are Random”
Spectral lines may look like scattered marks at first, but they are not random. Each line corresponds to a specific electron transition between two allowed energy levels. In hydrogen, these lines follow precise mathematical relationships, such as those described by the Rydberg formula.“Higher n Simply Means More Ordinary Energy”
For the hydrogen atom, energy increases as the principal quantum number n increases, but the bound-state energies are still negative. A higher n value means the electron is less tightly bound to the atom and closer to ionisation, not that it is simply moving with any freely chosen positive energy.“Emission and Absorption Are the Same Process”
Emission and absorption involve the same energy levels, but the transitions occur in opposite directions. Emission occurs when an electron moves from a higher level to a lower level and releases a photon. Absorption occurs when an electron gains energy from a photon and moves to a higher level.“All Electron Transitions Produce Visible Light”
Not all electron transitions produce visible light. In hydrogen, transitions ending at n = 1 form the Lyman series in the ultraviolet region. Many transitions ending at n = 2 form the familiar visible Balmer lines, while transitions ending at n = 3, n = 4, and higher levels lie mainly in the infrared region.“A Higher-Energy Photon Always Means Brighter Light”
Students sometimes confuse photon energy with brightness. A larger energy gap produces a higher-energy photon with a shorter wavelength, but brightness depends on how many photons are emitted and how much total energy reaches the observer. A small number of high-energy photons is not necessarily brighter than many lower-energy photons.“Spectral Lines Show Electron Paths”
Spectral lines do not show the path followed by an electron through space. They represent energy differences between quantum states. In modern quantum mechanics, electrons are described by wavefunctions and probability distributions rather than fixed classical orbits.“Energy Levels Are Evenly Spaced”
A very common misconception is that atomic energy levels are equally spaced. In hydrogen, the spacing between neighbouring levels decreases as n increases, following En = −13.6 / n2 eV. This is why spectral lines become closer together near the series limit.Why Study Atomic Spectra
Atomic spectra are worth studying because they turn invisible atomic structure into visible evidence. Every spectral line carries information about an electron transition, an energy gap, and a photon of a particular wavelength. By learning how to read these lines, students begin to see how quantum ideas are tested in the real world, not merely written as abstract equations.
Direct Evidence of Quantum Theory
Atomic spectra provide clear experimental evidence that energy in atoms is quantised. Atoms do not emit or absorb every possible wavelength of light. Instead, they produce discrete spectral lines because electrons can move only between specific allowed energy levels. The visible Balmer lines of hydrogen are a powerful example: they show that atomic energy changes occur in fixed steps rather than continuously.Understanding the Origin of Colour in Light
Atomic spectra explain why different substances emit different colours of light. Each colour corresponds to a particular frequency ν, determined by the energy difference between atomic levels through ΔE = hν. Sodium produces a strong yellow doublet, while neon produces the familiar red-orange glow of neon signs. These colours are not decorative accidents; they arise from precise electron transitions inside atoms.Link Between Theory and Measurement
Atomic spectra connect theoretical models with measurable quantities such as wavelength, frequency, and photon energy. When the predicted energy difference between two atomic levels matches an observed spectral line, the model gains experimental support. For example, the hydrogen transition from n = 3 to n = 2 corresponds to the red H-alpha line at about 656.3 nm, showing how theory and observation meet.Fingerprint Identification of Elements
Each element has its own arrangement of allowed energy levels, so each element produces a unique pattern of spectral lines. This makes spectra powerful tools for identifying elements, even in tiny amounts or at great distances. Astronomers can identify hydrogen, helium, sodium, calcium, and other elements in stars by comparing observed spectral lines with laboratory spectra. Helium was first detected in the Sun through its spectral signature before it was found on Earth.Foundation for Spectroscopy Techniques
Atomic spectra form the basis of many analytical techniques used in science, engineering, medicine, and industry. Atomic absorption spectroscopy, emission spectroscopy, flame tests, plasma spectroscopy, and laser-based methods all depend on the fact that atoms absorb or emit light at specific wavelengths. These techniques can detect trace metals in water, identify elements in materials, and monitor chemical composition in industrial processes.Applications in Astronomy and Cosmology
Atomic spectra allow scientists to study objects that are too distant to touch or sample directly. By analysing light from stars, nebulae, and galaxies, scientists can determine composition, temperature, density, and motion. Doppler shifts in spectral lines reveal whether an object is moving toward or away from Earth, helping researchers study stellar motion, galactic rotation, and the expansion of the universe.Technological Applications in Modern Devices
Many modern technologies rely on controlled light emission and absorption. Lasers use stimulated emission between energy levels to produce coherent light for communication, surgery, manufacturing, measurement, and research. Atomic clocks depend on highly precise atomic transitions to keep time with extraordinary accuracy. Light-emitting devices, spectroscopy instruments, and optical sensors all draw on the same basic principle: transitions between energy states produce specific photon energies.Gateway to Advanced Physics
Atomic spectra provide a natural bridge from classical physics to modern physics. They introduce students to energy quantisation, photons, quantum states, wave-particle duality, and the limits of classical models. Understanding spectral lines prepares students for deeper topics such as the Schrödinger equation, atomic orbitals, selection rules, quantum optics, lasers, and the interaction between matter and radiation.8. Frequently Asked Questions
Why are atomic spectral lines discrete?
Atomic spectral lines are discrete because electrons can move only between specific allowed energy levels. Each transition involves a fixed energy difference, so the atom emits or absorbs photons with precise energies and wavelengths.
What causes an emission spectrum?
An emission spectrum is produced when excited electrons fall from higher energy levels to lower energy levels. The lost energy is released as photons, creating bright spectral lines at specific wavelengths.
What causes an absorption spectrum?
An absorption spectrum is formed when atoms absorb photons from a continuous source of light. Electrons move to higher energy levels, and the absorbed wavelengths appear as dark lines in the otherwise continuous spectrum.
Why is the hydrogen spectrum important?
The hydrogen spectrum is important because hydrogen is the simplest atom. Its spectral lines helped reveal that electron energies are quantised and provided early evidence for quantum models of atomic structure.
Why do different elements have different spectra?
Different elements have different arrangements of electrons and different allowed energy levels. As a result, each element emits and absorbs its own unique set of photon energies, producing a distinctive spectral pattern.
How are atomic spectra used in astronomy?
Astronomers use atomic spectra to identify elements in stars, nebulae, and galaxies. By comparing observed spectral lines with laboratory spectra, scientists can determine the composition, temperature, motion, and physical conditions of distant objects.
Do all electron transitions produce visible light?
No. Some transitions produce ultraviolet light, some produce visible light, and others produce infrared radiation. In hydrogen, the Balmer series includes visible lines, while the Lyman series is mainly ultraviolet and the Paschen series is infrared.
What does a spectral line tell us about an atom?
A spectral line tells us that an electron has moved between two allowed energy levels. The wavelength of the line reveals the energy difference between those levels, allowing scientists to infer the internal structure of the atom.
9. Assessment Exercises
Part 1: Review & Conceptual Questions
Q1. Why do atoms produce discrete spectral lines instead of a continuous spectrum?
Answer: Atoms produce discrete spectral lines because electrons can occupy only specific allowed energy levels. When electrons move between these levels, they emit or absorb photons with fixed energies. These fixed photon energies correspond to specific wavelengths, producing sharp spectral lines rather than a continuous spread of colours.
Q2. Why does hydrogen produce fewer spectral lines than heavier elements?
Answer: Hydrogen has only one electron, so its energy-level structure is relatively simple. Heavier atoms contain many electrons, and electron-electron interactions split and modify their energy levels. This creates many more possible transitions and therefore more complex spectra.
Q3. Why are Lyman series lines in the ultraviolet region?
Answer: Lyman series transitions end at n = 1, the lowest energy level in hydrogen. These transitions involve large energy differences, so the emitted photons have high energy, high frequency, and short wavelength. This places them in the ultraviolet region.
Q4. What determines the colour of light emitted by an atom?
Answer: The colour of emitted light is determined by the photon wavelength, which depends on the energy difference between two atomic energy levels. Since ΔE = hν and E = hc / λ, a larger energy gap produces higher-frequency, shorter-wavelength light.
Part 2: Applied & Thought-Provoking Scenarios
Q5. Why do real spectral lines appear broadened rather than perfectly sharp?
Answer: In an idealised model, spectral lines are treated as perfectly sharp. In real systems, several effects broaden them:
- Thermal motion: Moving atoms experience Doppler shifts, spreading the observed wavelengths.
- Collisions: Collisions between atoms can disturb energy levels and shorten the lifetime of excited states.
- Quantum uncertainty: Finite excited-state lifetimes create a small uncertainty in energy, which broadens the spectral line.
Q6. Why can spectral lines be used to measure the velocity of stars?
Answer: Spectral lines have known laboratory wavelengths. If a star is moving relative to Earth, these lines are shifted by the Doppler effect. A shift toward longer wavelengths indicates recession, while a shift toward shorter wavelengths indicates approach. By measuring the size of the shift, astronomers can calculate the star’s radial velocity.
Q7. Why do multi-electron atoms produce more complex spectra than hydrogen?
Answer: Multi-electron atoms contain electron-electron interactions, shielding effects, spin-orbit coupling, and more possible electron configurations. These effects split and shift energy levels, producing many more allowed transitions. As a result, their spectra are richer and more complex than the simple hydrogen spectrum.
Q8. Why are absorption and emission lines for the same atom often found at the same wavelengths?
Answer: Absorption and emission involve the same pairs of energy levels. In absorption, an electron moves upward by taking in a photon with the required energy. In emission, an electron moves downward and releases a photon with the same energy difference. Because the energy gap is the same, the wavelength is also the same.
Part 3: Numerical Problems with Step-by-Step Worked Solutions
Problem 1: Energy of a Photon from a Hydrogen Transition
An electron in a hydrogen atom moves from n = 3 to n = 2. Calculate the energy of the emitted photon in electronvolts.
Solution:
For hydrogen, the energy of level n is:
$$ E_n = \frac{-13.6}{n^2} \text{ eV} $$
For n = 3:
$$ E_3 = \frac{-13.6}{3^2} = \frac{-13.6}{9} \approx -1.51 \text{ eV} $$
For n = 2:
$$ E_2 = \frac{-13.6}{2^2} = \frac{-13.6}{4} = -3.40 \text{ eV} $$
The photon energy is equal to the energy lost by the electron:
$$ E_{\text{photon}} = E_3 – E_2 = (-1.51) – (-3.40) = 1.89 \text{ eV} $$
Answer: The emitted photon has energy 1.89 eV.
Problem 2: Wavelength of the Emitted Light
Using the photon energy from Problem 1, determine the wavelength of the emitted photon. Use hc = 1240 eV·nm.
Solution:
The photon energy and wavelength are related by:
$$ E = \frac{hc}{\lambda} \Rightarrow \lambda = \frac{hc}{E} $$
Substitute hc = 1240 eV·nm and E = 1.89 eV:
$$ \lambda = \frac{1240}{1.89} \approx 656 \text{ nm} $$
Answer: The wavelength is approximately 656 nm, which lies in the red region of the visible spectrum. This is the hydrogen H-alpha line in the Balmer series.
Problem 3: Identifying the Spectral Series
An electron in a hydrogen atom moves from n = 4 to n = 2. Which spectral series does this transition belong to?
Solution:
Hydrogen spectral series are classified by the final energy level reached by the electron:
- Lyman series: transitions ending at n = 1
- Balmer series: transitions ending at n = 2
- Paschen series: transitions ending at n = 3
- Brackett series: transitions ending at n = 4
In this problem, the final level is n = 2. Therefore, the transition belongs to the Balmer series.
Answer: The transition belongs to the Balmer series, which includes visible hydrogen spectral lines.
Problem 4: Frequency of Emitted Light
A hydrogen spectral line has wavelength 486 nm. Calculate its frequency. Use c = 3.0 × 10⁸ m/s.
Solution:
Frequency and wavelength are related by:
$$ \nu = \frac{c}{\lambda} $$
Convert the wavelength to metres: 486 nm = 486 × 10−9 m.
Substitute into the equation:
$$ \nu = \frac{3.0 \times 10^8}{486 \times 10^{-9}} \approx 6.17 \times 10^{14} \text{ Hz} $$
Answer: The frequency is approximately 6.17 × 10¹⁴ Hz. This wavelength corresponds to blue-green light in the visible spectrum.
Problem 5: Understanding Absorption
A hydrogen atom absorbs a photon of energy 1.89 eV. Assuming the electron initially occupies n = 2, which transition is most likely to occur?
Solution:
From Problem 1, the energy difference between n = 3 and n = 2 is ΔE = 1.89 eV. During absorption, the electron gains energy and moves to a higher level. Therefore, an electron initially at n = 2 can absorb a 1.89 eV photon and move to n = 3 (n = 2 → n = 3).
Answer: The electron is excited from n = 2 to n = 3.
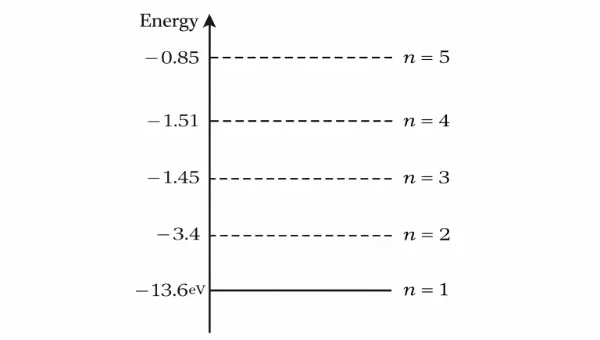
Graph-Based Problems: Energy Level Diagrams
Problem 6: Identifying Emission Transitions
An energy level diagram shows levels n = 1, 2, 3, 4. An electron drops from n = 4 to n = 2. (a) Is this emission or absorption? (b) Which spectral series does it belong to? (c) Is the photon high or moderate energy?
Solution:
(a) The electron moves to a lower level → emission.
(b) Final level is n = 2 → Balmer series.
(c) Energy difference is moderate → visible light.
Answer: Emission, Balmer series, moderate energy photon.
Problem 7: Comparing Transition Energies
From an energy level diagram, compare the transitions n = 4 → n = 2 and n = 3 → n = 2. Which produces higher energy photons?
Solution:
Energy difference is larger for n = 4 → n = 2. Therefore, E4→2 > E3→2.
Answer: n = 4 → n = 2 produces higher energy photons.
Problem 8: Determining Wavelength from Diagram
An energy diagram shows E3 = −1.51 eV and E2 = −3.4 eV. Calculate the wavelength for the transition n = 3 → n = 2.
Solution:
ΔE = (−1.51) − (−3.4) = 1.89 eV. Using λ = 1240 / 1.89 ≈ 656 nm.
Answer: 656 nm (red light).
Problem 9: Absorption vs Emission from Diagram
An electron is shown moving from n = 2 to n = 5 on an energy level diagram. (a) Is this emission or absorption? (b) What happens to the photon?
Solution:
(a) Moving upward → absorption.
(b) The atom absorbs a photon with energy ΔE = E5 − E2.
Answer: Absorption; photon energy is taken in by the atom.
Problem 10: Series Identification from Diagram
An energy level diagram shows several transitions ending at n = 1. (a) What series is this? (b) What region of the spectrum?
Solution:
(a) Lyman series. (b) High-energy transitions → Ultraviolet region.
Answer: Lyman series, ultraviolet radiation.
Problem 11: Convergence of Energy Levels
In an energy level diagram, the spacing between levels decreases as n increases. Explain why spectral lines get closer together at higher energy levels.
Solution:
Energy levels follow En = −13.6 / n2. As n increases, En → 0 and differences between levels decrease. Thus, emitted photon energies become similar, and spectral lines converge.
Answer: Energy gaps shrink at high n, causing spectral lines to cluster together.
Exam Strategy and Common Mistakes: Atomic Spectra
Success in atomic spectra questions depends on more than memorising formulas. Students must first identify the electron transition, decide whether the atom is emitting or absorbing a photon, choose the correct relationship, and keep units consistent. Many mistakes occur not because the physics is very difficult, but because the direction of the transition or the sign of the energy change is interpreted incorrectly.
The following guide summarises practical strategies and common pitfalls when working with hydrogen energy levels, spectral series, photon energy, wavelength, and frequency.
1. Identify the Transition Before Calculating
Before using any formula, identify the initial and final energy levels. If the electron moves upward, the atom absorbs energy. If the electron moves downward, the atom emits a photon.
- Absorption: nlow → nhigh
- Emission: nhigh → nlow
2. Use the Correct Energy Difference
Photon energy comes from the difference between two energy levels:
$$ \Delta E = E_{\text{higher}} – E_{\text{lower}} $$
For emission, the electron loses energy, but the emitted photon has positive energy. If your calculation gives a negative photon energy, take the magnitude of the energy gap: Ephoton = |ΔE|. Photon energy cannot be negative.
3. Remember That Hydrogen Energy Levels Are Negative
For hydrogen, bound-state energies are negative: En = −13.6 / n2 eV. A larger value of n means that the electron is less tightly bound and closer to ionisation. It does not mean that the electron already has positive energy while it remains bound to the atom.
4. Know Which Formula to Use
- En = −13.6 / n2: gives the hydrogen energy level in eV.
- Ephoton = ΔE: gives the photon energy from the energy gap.
- E = hν: connects photon energy with frequency.
- E = hc / λ: connects photon energy with wavelength.
- 1 / λ = RH (1 / nf2 − 1 / ni2): gives hydrogen spectral wavelengths using the Rydberg formula.
5. Watch Units Carefully
A frequent mistake is mixing units without conversion. Be especially careful with electronvolts, joules, nanometres, metres, frequency, and wavelength.
- If using c = 3.0 × 10⁸ m/s, wavelength must be in metres.
- If using hc = 1240 eV·nm, energy must be in eV and wavelength must be in nm.
- If using h = 6.63 × 10⁻³⁴ J·s, energy will be in joules unless converted to eV.
6. Use hc = 1240 eV·nm When Appropriate
When photon energy is in electronvolts and wavelength is in nanometres, the shortcut E = 1240 / λ is often convenient. This avoids converting between joules and electronvolts, but it works only if the units are used consistently.
7. Recognise Hydrogen Spectral Series Quickly
- nf = 1: Lyman series, ultraviolet region
- nf = 2: Balmer series, visible and near-visible region
- nf = 3: Paschen series, infrared region
- nf = 4: Brackett series, far infrared region
8. Check the Order of Magnitude
- Visible light is roughly 400 nm to 700 nm.
- Ultraviolet light has shorter wavelengths and higher photon energies.
- Infrared light has longer wavelengths and lower photon energies.
- The hydrogen H-alpha line is about 656 nm.
9. Do Not Assume Energy Levels Are Evenly Spaced
Hydrogen energy levels are not equally spaced. The gap between n = 1 and n = 2 is much larger than the gaps between higher levels. As n increases, the levels get closer together and approach the ionisation limit. This is why spectral lines become closer together near a series limit.
10. Common Mistake: Reversing Absorption and Emission
Students often confuse the direction of the transition. An upward transition requires the atom to absorb a photon. A downward transition causes the atom to emit a photon.
11. Common Mistake: Using the Wrong Energy Values
Be consistent with common hydrogen energy levels: E1 = −13.6 eV, E2 = −3.40 eV, E3 = −1.51 eV, E4 = −0.85 eV.
12. Common Mistake: Confusing Photon Energy with Brightness
A higher-energy photon has a higher frequency and shorter wavelength, but it is not automatically brighter. Brightness depends on the number of photons and the total energy reaching the observer, not only on the energy of one photon.
13. Common Mistake: Treating Spectral Lines as Electron Paths
A spectral line does not show the physical path of an electron around the atom. It represents an energy difference between quantum states. In modern atomic physics, electrons are described by wavefunctions and probability distributions, not by fixed classical paths.
Final Exam Tip
For most atomic spectra problems, use this sequence: identify the transition, decide emission or absorption, find the energy gap, convert to photon energy, then calculate frequency or wavelength if needed. This simple order prevents many common mistakes.
Master Problem Bank: Atomic Spectra (Extended Practice)
Level 1: Fundamental Concepts
Q1. What is meant by quantised energy levels?
Solution: Electrons can only occupy specific discrete energy values, not a continuous range.
Q2. Why are spectral lines discrete?
Solution: Because electrons transition only between fixed energy levels, producing photons with specific energies.
Q3. What is excitation?
Solution: The process where an electron absorbs energy and moves to a higher energy level.
Q4. What is emission?
Solution: The process where an electron falls to a lower energy level and releases a photon.
Q5. Why does hydrogen have a simpler spectrum?
Solution: It has only one electron, so there are fewer interactions and simpler energy levels.
Level 2: Core Calculations
Q6. Calculate the energy of level n = 2.
Solution: E2 = −13.6 / 4 = −3.4 eV. Answer: −3.4 eV.
Q7. Calculate the energy difference between levels n = 3 and n = 1.
Solution: ΔE = (−1.51) − (−13.6) = 12.09 eV. Answer: 12.09 eV.
Q8. Find the energy for transition n = 2 → n = 1.
Solution: ΔE = (−3.4) − (−13.6) = 10.2 eV. Answer: 10.2 eV.
Q9. Find the energy for transition n = 3 → n = 2.
Solution: ΔE = (−1.51) − (−3.4) = 1.89 eV. Answer: 1.89 eV.
Q10. Find the wavelength for 1.89 eV.
Solution: λ = 1240 / 1.89 ≈ 656 nm. Answer: 656 nm.
Level 3: Multi-Step Problems
Q11. Calculate the wavelength for transition n = 4 → n = 2.
Solution: ΔE = (−0.85) − (−3.4) = 2.55 eV. λ = 1240 / 2.55 ≈ 486 nm. Answer: 486 nm.
Q12. Calculate frequency for 486 nm.
Solution: ν = (3.0 × 10⁸) / (486 × 10−9) ≈ 6.17 × 10¹⁴ Hz. Answer: 6.17 × 10¹⁴ Hz.
Q13. Identify the spectral series for n = 5 → n = 2.
Solution: Balmer series (visible region).
Q14. Why do spectral lines converge at high n?
Solution: Energy levels get closer together as n increases.
Q15. Why does shorter wavelength mean higher energy?
Solution: E = hc / λ, so energy is inversely proportional to wavelength.
10. Glossary: Atomic Spectra and Energy Transitions
This glossary summarises key terms used in atomic spectra, hydrogen energy levels, electron transitions, and spectroscopy. These terms help students connect the language of quantum theory with observable spectral lines.
- Atomic Spectrum
- The pattern of wavelengths emitted or absorbed by atoms. Atomic spectra appear as distinct lines because electrons move only between allowed energy levels.
- Emission Spectrum
- A spectrum of bright lines produced when excited electrons fall to lower energy levels and release photons with specific energies.
- Absorption Spectrum
- A spectrum containing dark lines where atoms have absorbed specific wavelengths from a continuous light source, causing electrons to move to higher energy levels.
- Quantised Energy Levels
- The specific allowed energies that electrons can occupy in an atom. Electrons cannot exist at arbitrary intermediate energies between these allowed levels.
- Electron Transition
- The movement of an electron from one allowed energy level to another. A downward transition emits a photon, while an upward transition absorbs a photon.
- Photon
- A quantum of electromagnetic radiation. In atomic spectra, each photon has an energy determined by the difference between two atomic energy levels.
- Balmer Series
- The hydrogen spectral series formed by transitions ending at n = 2. Several Balmer lines lie in the visible region, including the red H-alpha line.
- Lyman Series
- The hydrogen spectral series formed by transitions ending at n = 1. These transitions involve larger energy gaps and lie mainly in the ultraviolet region.
- Paschen Series
- The hydrogen spectral series formed by transitions ending at n = 3. These transitions lie mainly in the infrared region.
- Rydberg Formula
- A formula used to calculate the wavelengths of hydrogen spectral lines:$$ \frac{1}{\lambda} = R_H \left( \frac{1}{n_f^2} – \frac{1}{n_i^2} \right) $$where RH is the Rydberg constant for hydrogen.
- H-alpha Line
- The red Balmer line of hydrogen produced by the transition n = 3 → n = 2, with wavelength about 656.3 nm.
- Spectral Fingerprint
- The distinctive pattern of spectral lines produced by an element. Because each element has its own energy-level structure, spectra can be used to identify substances.
- Doppler Shift
- A change in observed wavelength caused by relative motion between a source and an observer. Redshift indicates motion away, while blueshift indicates motion toward the observer.
- Line Broadening
- The widening of spectral lines caused by effects such as thermal motion, collisions, pressure, or the finite lifetime of excited states.
- Ionisation Limit
- The energy limit at which an electron is no longer bound to the atom. In hydrogen, the bound energy levels approach 0 eV as n → ∞.
11. Cluster Sub-Hub Navigation Links & Academic References
Related Prep4Uni.online Learning Pages
Atomic Spectra and Energy Transitions connects naturally with other pages in the Atomic Physics, Quantum Mechanics, and Modern Physics clusters. These related pages help students build a broader understanding of atomic structure, quantised states, electron behaviour, and the interaction between matter and radiation.
- Modern Physics — Introduces the wider shift from classical physics to quantum, relativistic, nuclear, and particle-based explanations of nature.
- Atomic Physics — Provides the main cluster overview for atomic structure, spectra, quantum numbers, electron configuration, and atom–radiation interactions.
- Structure of the Atom — Explains how atoms are organised and how modern atomic models differ from earlier classical pictures.
- Quantum Numbers and Electron Configuration — Shows how quantum numbers, orbitals, shells, subshells, and spin determine allowed electron arrangements.
- Atomic Interactions with Radiation — Explores how atoms absorb, emit, scatter, and respond to photons through excitation, ionisation, fluorescence, and stimulated emission.
- Quantum Mechanics — Provides the broader quantum framework needed to understand wavefunctions, energy quantisation, probability, and atomic behaviour.
- The Wave Function and Schrödinger’s Equation — Explains the mathematical foundation behind allowed quantum states and energy levels.
- Wave-Particle Duality — Helps students understand why electrons and photons require quantum descriptions rather than purely classical models.
External References
The following references provide authoritative data, background reading, and supporting explanations for atomic spectra, hydrogen spectral lines, and the electromagnetic spectrum.
- NIST Atomic Spectra Database — A major reference database for atomic spectral lines, energy levels, ionisation energies, and related atomic data.
- NIST Atomic Spectra Database Lines Form — A searchable interface for looking up spectral lines by element, ionisation state, wavelength range, and related parameters.
- NIST Basic Atomic Spectroscopic Data Handbook — A handbook of selected atomic spectral data, useful for checking wavelengths, intensities, and spectrum assignments.
- NASA Introduction to the Electromagnetic Spectrum — A student-friendly introduction to the electromagnetic spectrum and how different wavelengths are used in science and astronomy.
- HyperPhysics: Hydrogen Energies and Spectrum — A useful conceptual reference on hydrogen energy levels and the relationship between energy transitions and spectral lines.
Suggested Citation
Archived version: This learning resource is archived on Zenodo at https://zenodo.org/records/20570351.
Suggested citation: Gan, J. (2026). Atomic Spectra and Energy Transitions: Emission, Absorption and Energy Levels. Prep4Uni.online. Zenodo. https://doi.org/10.5281/zenodo.20570351